Urban Violent Crime & Legal Gun Ownership: A Story of Geographical Assault in the U.S.
Crime in America is concentrated in only 0.5% of counties, which is home to only 0.8% of the nation’s population - yet these counties account for 25% of the nation’s homicides.
How can it be that the entire nation’s homicide rate is consistently disproportionately higher in only a few counties?
We examined violence trends in a handful of the most dangerous cities and counties in the United States.
Report Highlights:
-
1% of U.S. counties accounted for nearly 35% of all homicides in 2022.
-
In 2022, urban areas with over 1 million people accounted for the most murders, totaling 11,729.
-
Urban areas with over 1 million people have a per capita homicide rate of 11.6 per 100,000, whereas suburban areas of the same size have a rate of only 4 per 100,000.
-
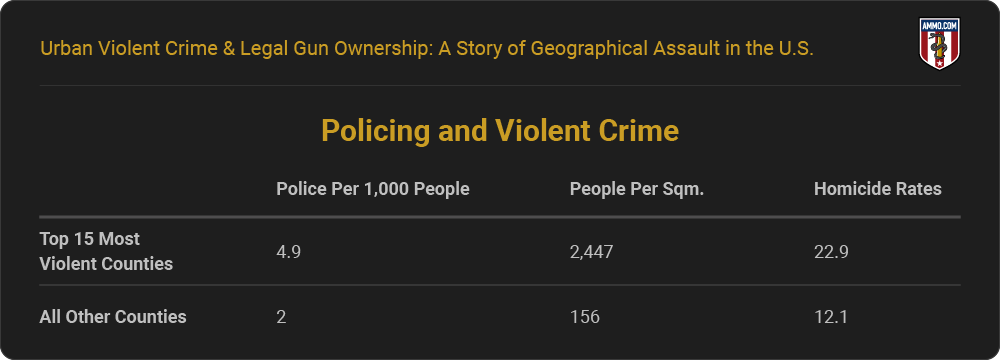
In the top 15 high-homicide-rate counties, there are only 12 police officers per square mile, despite densities of over 2,000 people per square mile. Safer areas have about 2 officers per square mile, serving populations of fewer than 200 people per square mile.
-
Rural areas, with only 10% of all homicides, have a firearm ownership rate of 46%.
-
Tighter gun control doesn't necessarily lead to safer communities; the most dangerous U.S. counties have differing levels of gun regulation, ranging from lax to strict.
For this article, we reference data from the Bureau of Justice Statistics National Crime Victimization Survey and a 2021 publication in the American Journal of Public Health. We’ve included a comprehensive list of our sources here.
Geographically Concentrated Violent Crimes
Of the nation’s 3,124 counties, only 15 contribute to nearly a quarter of all homicides. Furthermore, these counties top the lists for violent crime and homicide year after year. If we expand this a little further, 42% of all homicides occurred in only 50 counties (25% of the nation’s entire population).
Notably, counties with more people will have more crimes and homicides. However, not all urban areas tend to have a crime and homicide problem.
Counties with large cities (more than 1,000,000 people) comprise all but one of the top most violent counties. On the other hand, several fringe metros (counties with more than 1,000,000) have very low violent crime and homicide rates.
The disparities between highly populated areas and crime, homicide, and gun laws show us that there is more to urban crime than simply population size.
For example, Cook County, IL, consistently tops all other areas for homicides. Moreover, the county that’s home to Chicago has an excess of homicides for its population size. While Illinois has a homicide rate of 11.7 per 100,000 people, Cook County contributes 71% of those homicides to the state.
If we remove Cook County (Chicago), Illinois’ homicide rate drops to only 5.7 per 100,000 people. Furthermore, counties close to Cook County have lower homicide rates than their population sizes would predict.
We see this same pattern with the other top counties for homicides.
In Baltimore, Philadelphia, Detroit, and Memphis, the homicide rates are higher than models predict, while surrounding areas are incredibly peaceful. If we remove only those areas from the state’s homicide reports, the entire state’s homicide rate will decrease drastically.
Looking at per capita firearm-homicide rates, Cook County, IL; Wayne County, MI; and Philadelphia County, PA, far surpass several other counties with larger populations, San Diego, CA, and Harris County, TX, for example.
So, the next logical area of research is, other than population size, why do those specific counties have so many problems with violence?
Putting It All Together
We now know that population size alone doesn’t determine criminality. We have to look into other factors that make Cook County and Philadelphia County more violent than, say Fairfax County, VA, or Middlesex County, MA.
We looked into factors such as education, poverty, single-parent households, and policing to better understand the most violent urban areas in the U.S.
While poverty and other factors were common across the board, we did notice disparities in policing, clearance rates (number of homicides solved), poverty, race, and street gangs.
Policing & Violent Crime/Homicide Rates
When Chicago’s Washington Park neighborhood has a violent crime rate 701% higher than the national average and only 12 full-time officers per square mile, there simply aren’t enough police officers to handle the sheer number of criminals in the area.
At the local level, DAs, mayors, and police departments serve as the front line to combat violent crime. An environment that nurtures crime is one where people resort to violence out of fear, too few police officers, and soft-on-crime policies. This seems to be the case with many dangerous neighborhoods in America.
In the top 15 counties with the highest homicide rates, there is a notable scarcity of police officers per square mile when considering both homicide rates and population density. These areas typically have 12 police officers for every square mile, despite having over 2,000 people per square mile. In contrast, safer regions with lower homicide rates have a higher ratio of police officers, approximately 2 officers per square mile, serving populations of less than 200 people per square mile.
The most dangerous areas have an average population density of 2,447 people per square mile, whereas there’s an average of only 156 per square mile in all other areas. They also have more crime and too few police officers to combat it.
Essentially, the most violent counties in America have an average of 12 police officers per square mile, while the safer ones have only two officers per square mile. However, when residents have a 1 in 39 chance (or higher) of being victimized by a criminal, 12 police officers aren’t enough to protect, investigate, and catch repeat criminals.
Solving Homicides in Violent Urban Areas
The fifteen most violent counties in America have a clearance rate 21% lower than all other areas with homicides.
We’re starting to see a pattern - fewer police officers mean fewer crimes solved and more criminals committing more crimes.
Furthermore, urban centers have higher rates of gang membership, which further compounds the problem. Not only do gang members who go uncaught continue to commit crimes, but gang leaders continue to lead and convert more people to criminal lifestyles.
Poverty
Another distinct pattern we see in the most violent counties is poverty. Households with individuals under 18 years of age have 20% higher rates of food assistance, 30% higher rates of single-parent homes, and 31% higher rates of households living below the poverty line, as opposed to other counties.
Therefore, the most violent counties in America do show some relation between poverty and crime rates. However, poverty is not a key factor in criminality. There are plenty of examples where high poverty rates are not associated with high crime rates - for example, impoverished coal mining towns in Appalachia.
When you put more people in smaller spaces with limited resources, crime may become more prevalent. While policing and catching criminals can keep the crime rates low, the most violent counties are letting criminals run rampant in impoverished areas, further exacerbating violent crime and homicides.
Race
In a sobering, startling, and upsetting revelation, we pulled a report filtering race, county, and per capita homicide rates using the CDC Wonder and discovered that the top 110 counties with those filters were all black victims.
We would be doing a disservice to Americans most at risk for homicides if we did not address race in our research. While it is a sensitive subject for many, we will not save a single life by ignoring the data and facts about racial disparities and homicide in the U.S.
Although race does not factor into whether one will commit murder or violent crimes, black and Hispanic individuals living in urban areas are at a higher risk of being a homicide victim than other demographics.
In the most dangerous cities in America, black and Hispanic Americans are murdered at disproportionately higher rates than other races and ethnicities.
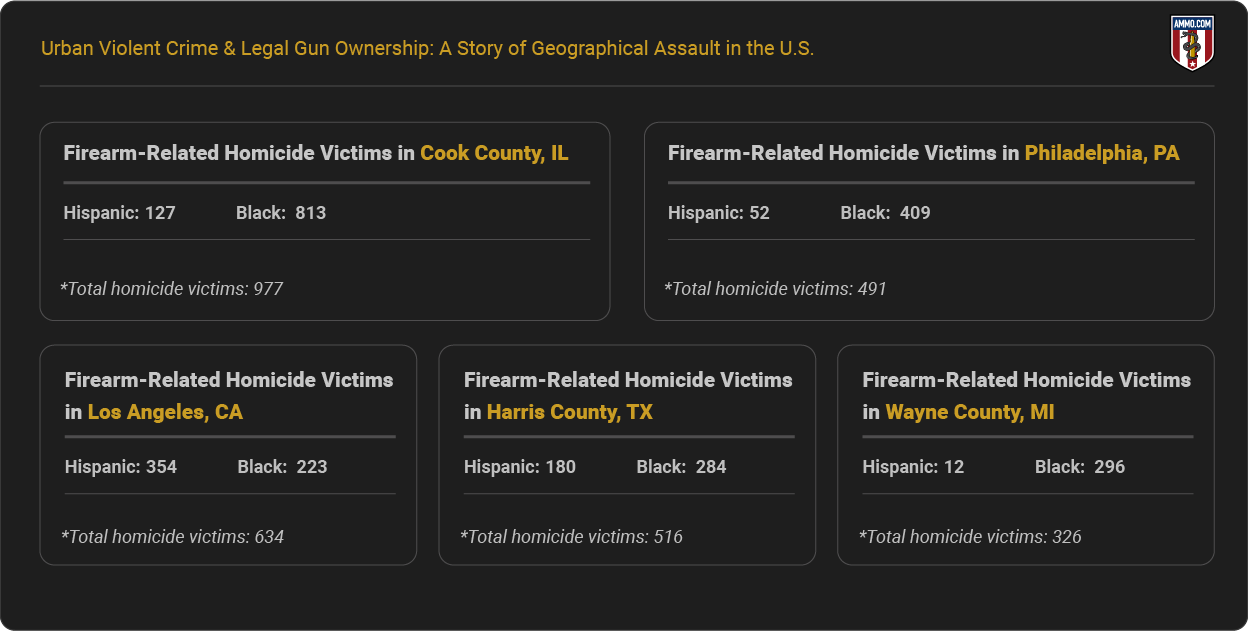
This pattern continues—we continue to see disproportionately higher homicide victim rates among black and Hispanic individuals in urban centers that remain high on the list of homicides.
*Note: It’s important to remember that these are homicide victims and not crime stats based on race.
Gang Membership and Urban Violence
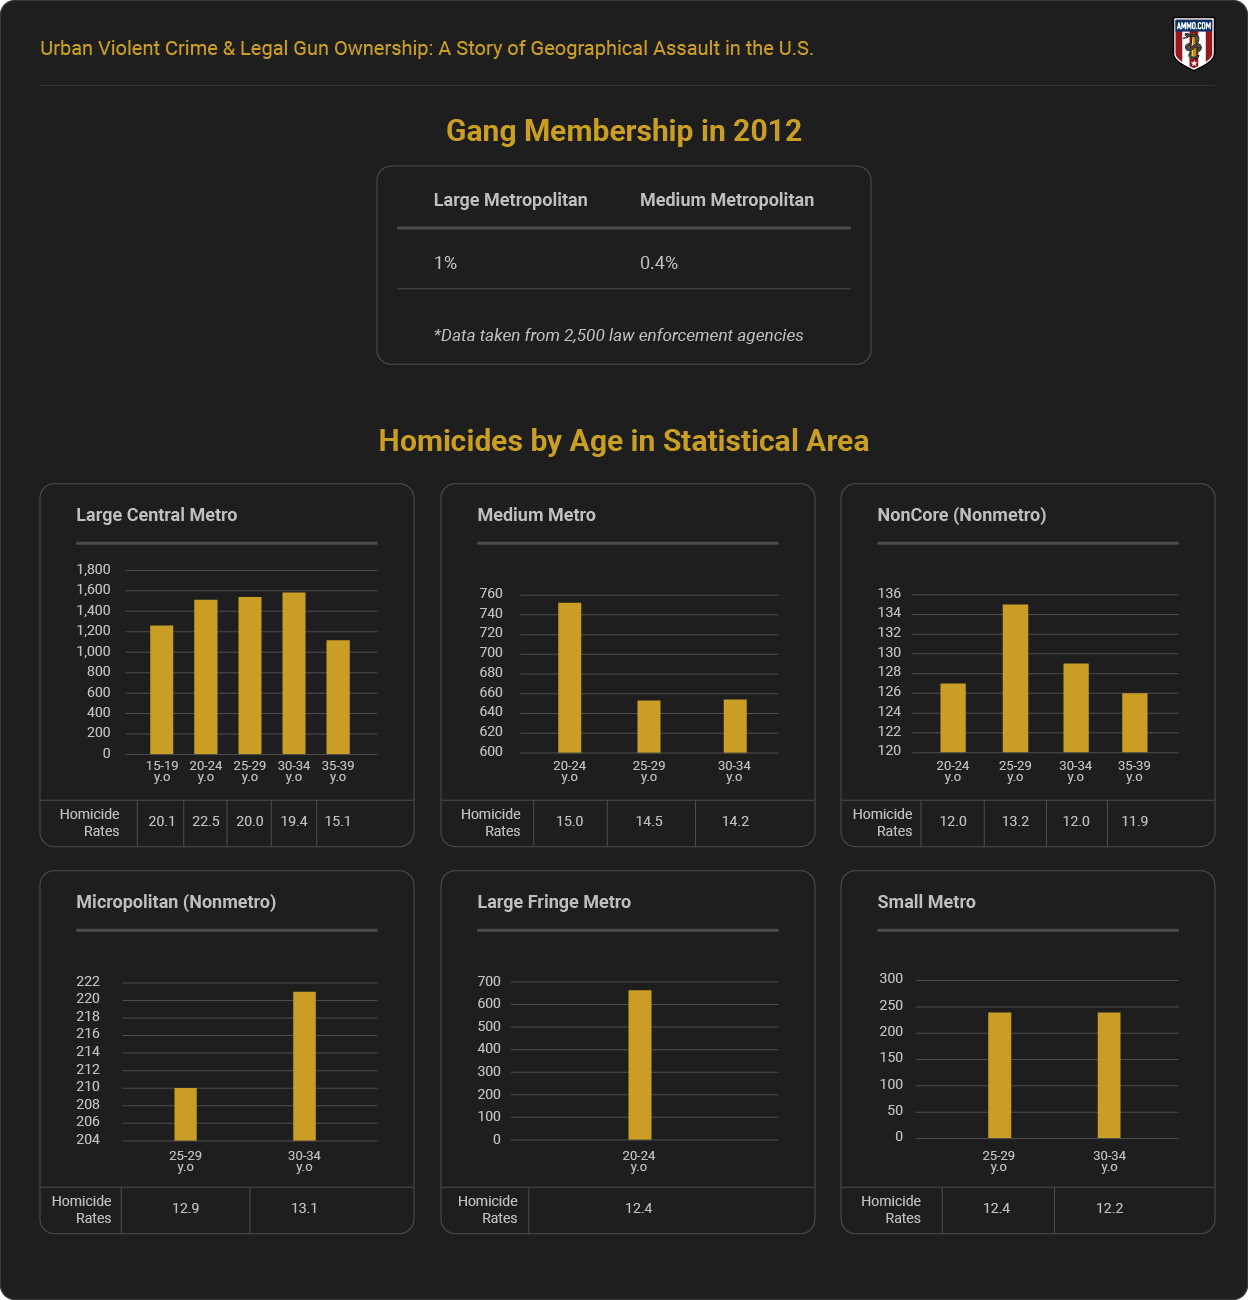
Gang membership data hasn’t been available since the 1990s and early 2000s. However, we can assess reports dating back to 2012 and see that of 2,500 law enforcement agencies report 1% gang membership in large metropolitan areas and .4% total gang membership in medium metro areas. These two metropolitan statistical areas have the highest concentration of the nation’s homicides.
While this data doesn’t immediately stand out among all population sizes, it becomes more apparent when we break this down by age. Individuals between the ages of 14 to 24 are most likely to partake in gang activities and also comprise the highest homicide rates.
In fact, the excess number of homicides in the most dangerous counties is two times higher among gang-aged individuals.
Gang prevalence is higher in the most violent U.S. counties. This may account for the racial disparities in homicide victims among the two most at-risk groups, Hispanic and black Americans.
Combining the Variables
Policing and clearance rates have a consistent correlation with violent crime.
Twelve police officers per square mile in an area with more than 7,000 violent crimes per 100,000 leads to low clearance rates. Clearance rates have been reported as low as 53% in some of these violent counties. When nearly half of the criminals in your city get away with crimes, they will continue to offend and even encourage others to join them.
After considering policing and clearance rates, the correlation between poverty and violent crime becomes slightly more apparent. While poverty is an issue nationwide, there is a moderate correlation between single-parent households and those receiving cash assistance in the nation’s most dangerous counties.
There are exceptions; while policing tends to be a common factor in high-crime populations, New York County often appears near the top of the list and has six times the number of full-time officers as the other top counties.
These variables tend to be consistent in counties with more homicides and are not as prevalent in those with fewer homicides.
Culture and Legislation
As with everything in nature, extremes can only be neutralized by extremes. Let’s look at the reactions of local leaders as they relate to the area’s crime rates.
For example, Chicago, IL, consistently has homicide victims every weekend, and local leaders simply respond with, “We need to do better.” On the contrary, Polk County, FL, is much safer, and local leaders respond in kind, “If you kick my door in, in the middle of the night, I will kill you graveyard dead.”
As we saw in the early 1990s, violent crime, and homicide rates plummeted with tough-on-crime policies and leaders willing to stand behind them. In 2018, defunding the police rhetoric and soft-on-crime policies became prevalent in the most dangerous counties.
Ultimately, culture and legislation aren’t the leading causes of high homicide and crime rates, but these factors do tend to be prevalent among the most dangerous areas. Local politicians' unwillingness to directly address criminality and soft-on-crime policies rooted in sympathy for criminals will logically allow crime to take over.
Urban Violent Crimes & Correlations
Criminality will never have a one-size-fits-all answer. We can only analyze the data to identify correlations or different patterns between populations and the different variables that may lead to violent crime. Unfortunately, the counties that consistently rank at the top for violent crime year after year have yet to find a solution to this ongoing problem.
Sources
- Neighborhood Racial and Economic Segregation and Disparities in Violence During the COVID-19 Pandemic
- Criminal Neglect
- Violent Crime in the U.S. (FBI)
- Crime Rates
- 2016 BJS Report
- Violent Crime Victimizations 2021
- BJS Violent Offenses By Demographic
- NCVS Violent Crime Report
- Bureau of Justice Statistics - Criminal Victimization, 2022
- Cities with the highest murder rates per capita
- Alaska Crime Rates
- Single-Parent Homes Urban Crime
- Criminality in Cities (FBI)
- Total Reported Crime by Precinct
- Population by City

Infographics
- Are Guns & Ammo The New Gold? Why More Americans Are Arming Themselves
- The Greatest Gun Salesman In America: President Barack Obama
- Shooting Straight: How Both Presidential Candidates Have Changed On Gun Control
- President Obama: (Still) The Greatest Gun Salesman in America
- An Inconvenient Truth: How The Obama Administration Became Earth's Largest Arms Dealer
- Armed Drones: President Obama's Weapon of Choice
- COVID-19 Data Study: Ammunition Sales Continue to Soar in Response to Coronavirus Panic
- Data Study: 18 Months of Ammo Sales during a Pandemic, Protests, and the Biden Presidency
- Data Study: U.S. Ammo Sales Surge Following Russian Invasion of Ukraine
- Most Gun-Friendly States
- Worst States to be a Gun Owner
- Children & Firearms: Definitions and Demographics Make All the Difference
- Urban Violent Crime & Legal Gun Ownership
- Gun-Free School Zone Laws & School Shootings
- Gun Control Laws and Enforcement Trends
- Gun Ownership by State
- How Many Gun Owners are in America?
- Concealed Carry Crime Stats
- Accidental Shooting Statistics: A Review of Unintentional Firearm Deaths
- America's Stolen Guns: A Silent Contributor to Gun Crimes in the U.S.
- Gun Violence Statistics: Comprehensive Look at the Data
- Gun Laws vs. Crime Rates: A Comprehensive Analysis
- Gun Death Statistics by Caliber: A Review of Calibers and Crime
- Anti-Gun Control Arguments: Facts Gun Control Lobby Suppress
- Guns in the Home Statistics: The Effects of Firearms in the Home
- Gun Deaths in the US: Analyzing At-Risk Demographics
- How Many Guns in the U.S.: All About America's Firearms
- Gun Facts in the U.S.: The Reality of Firearms in America
- Defensive Gun Use Statistics: America's Life-Saving Gun Incidents
- Correlation Between Mass Shootings and Prescription Drugs
- Gun Ownership by Gender: Closing the Gender Gap
- Murders by Weapon Type: Statistics
- Gun Violence Among Black Americans: Statistics
- The Ultimate Hunting Caliber Chart: Best Cartridge Per Species
- How Old Do You Have to be to Buy a Gun: A State Guide
- Most Popular Guns in the U.S.: The Must-Have Guns
- Stray Bullet Deaths: Accident and Injury Statistics
- Mass Shooters by Race: Demographics of Assailants
- Ammunition Limits By State: How Much Ammo Can You Buy?
- Why Do Americans Own Guns?
- How Many Americans Want Stricter Gun Laws?
- How Many Households in the U.S. Have a Gun?
- What Percentage of Gun Deaths are Suicides?
- Average Age of Mass Shooters in the U.S.
- Firearm Ownership in America by Year
- US Firearms Deaths Per Year: A Collective Report
- Percentage of Americans Owning Guns
- Texas Gun Ownership: Total Numbers, Trends, and Most Popular Guns
- Gun Ownership Statistics Colorado: Trends & Numbers
- Hunting Accident Statistics (Causes & Trends Per Year)
- Banned Guns & Ammo List: A Review by State
- 3D Printed Gun Laws By State
- How To Build a Home Shooting Range: The Ultimate Guide
- States With the Highest Murder Rates
- Best Self-Defense Weapons for Women
- Easiest States to Buy a Gun
- Cities with the Lowest Crime Rate
- Oregon Homicide Rates
- Chicago Homicide Rate
- How Much Does a Suppressor Reduce Noise
- Texas Homicides: Statistics and Trends
- California Homicides: Rates Per 100K
- Florida Murder Rate: Statistics and Trends
- Gun Ownership by Political Party
- Mass Shooters by Gender
- U.S. Hunting and Fishing Statistics
- Where Are Silencers Illegal? State Suppressor Laws
- How Loud is a Gunshot?
- What States Have the Strictest Gun Control?
- Causes of Mass Shootings in the U.S.