Concealed Carry Crime Stats 2026: The Impact of Open Carry on Crime in the U.S.
Report Highlights: In 2026, 29 states have permitless concealed carry freedoms. Concealed carry legislation has no consistent impact on crime in the U.S.
-
The U.S. violent crime rate peaked at 758.1 incidents per 100,000 in 1991, when only ten states had right-to-carry legislation. The violent crime rate declined to 359.1 per 100,000 in 2024 when 41 states implemented right-to-carry legislation.
-
Of the 12 states that passed permitless carry laws between 2019 and 2022, 11 had lower crime rates in 2024 than they did in 2019.
-
The unweighted average violent crime rate among permitless carry states was 311.9 per 100,000 in 2024. The collective average violent crime rate in permit-required states was 335.1 per 100,000.
Ammo.com provides accurate information from reputable sources. You can view the sources cited in this article.
Methodology
Violent crime and homicide rates are sourced from the FBI’s Uniform Crime Reporting (UCR) program and the Centers for Disease Control and Prevention (CDC) WONDER database. All data used in this article are from those sources, and cross-referenced with local reports to ensure accuracy.
Although 29 states have permitless carry (also referred to as “Constitutional carry”), only 20 enacted legislation to that effect before 2023. This analysis is limited to those states as that is the time period when violent crime and homicide data stabilized after the pandemic.
Violent crime, as defined by the FBI, includes homicide, rape, robbery, and aggravated assault. Rates were calculated using the FBI NIBRS/Crime Data Explorer and reflect violent crime incidents per 100,000 people.
“Constitutional carry legislation” refers to laws that allow civilians to conceal or openly carry a firearm in public places without a permit. “Open carry legislation” refers to states that allow civilians to openly carry firearms in public places. “Concealed carry legislation” refers to state laws allowing civilians to carry a concealed firearm in public, but may still restrict or require a permit for open carry. Shall-issue legislation refers to the state’s pro-permit issuing policies, where issuing authorities must issue permits to those not-prohibited for possessing firearms.
States With Concealed Carry
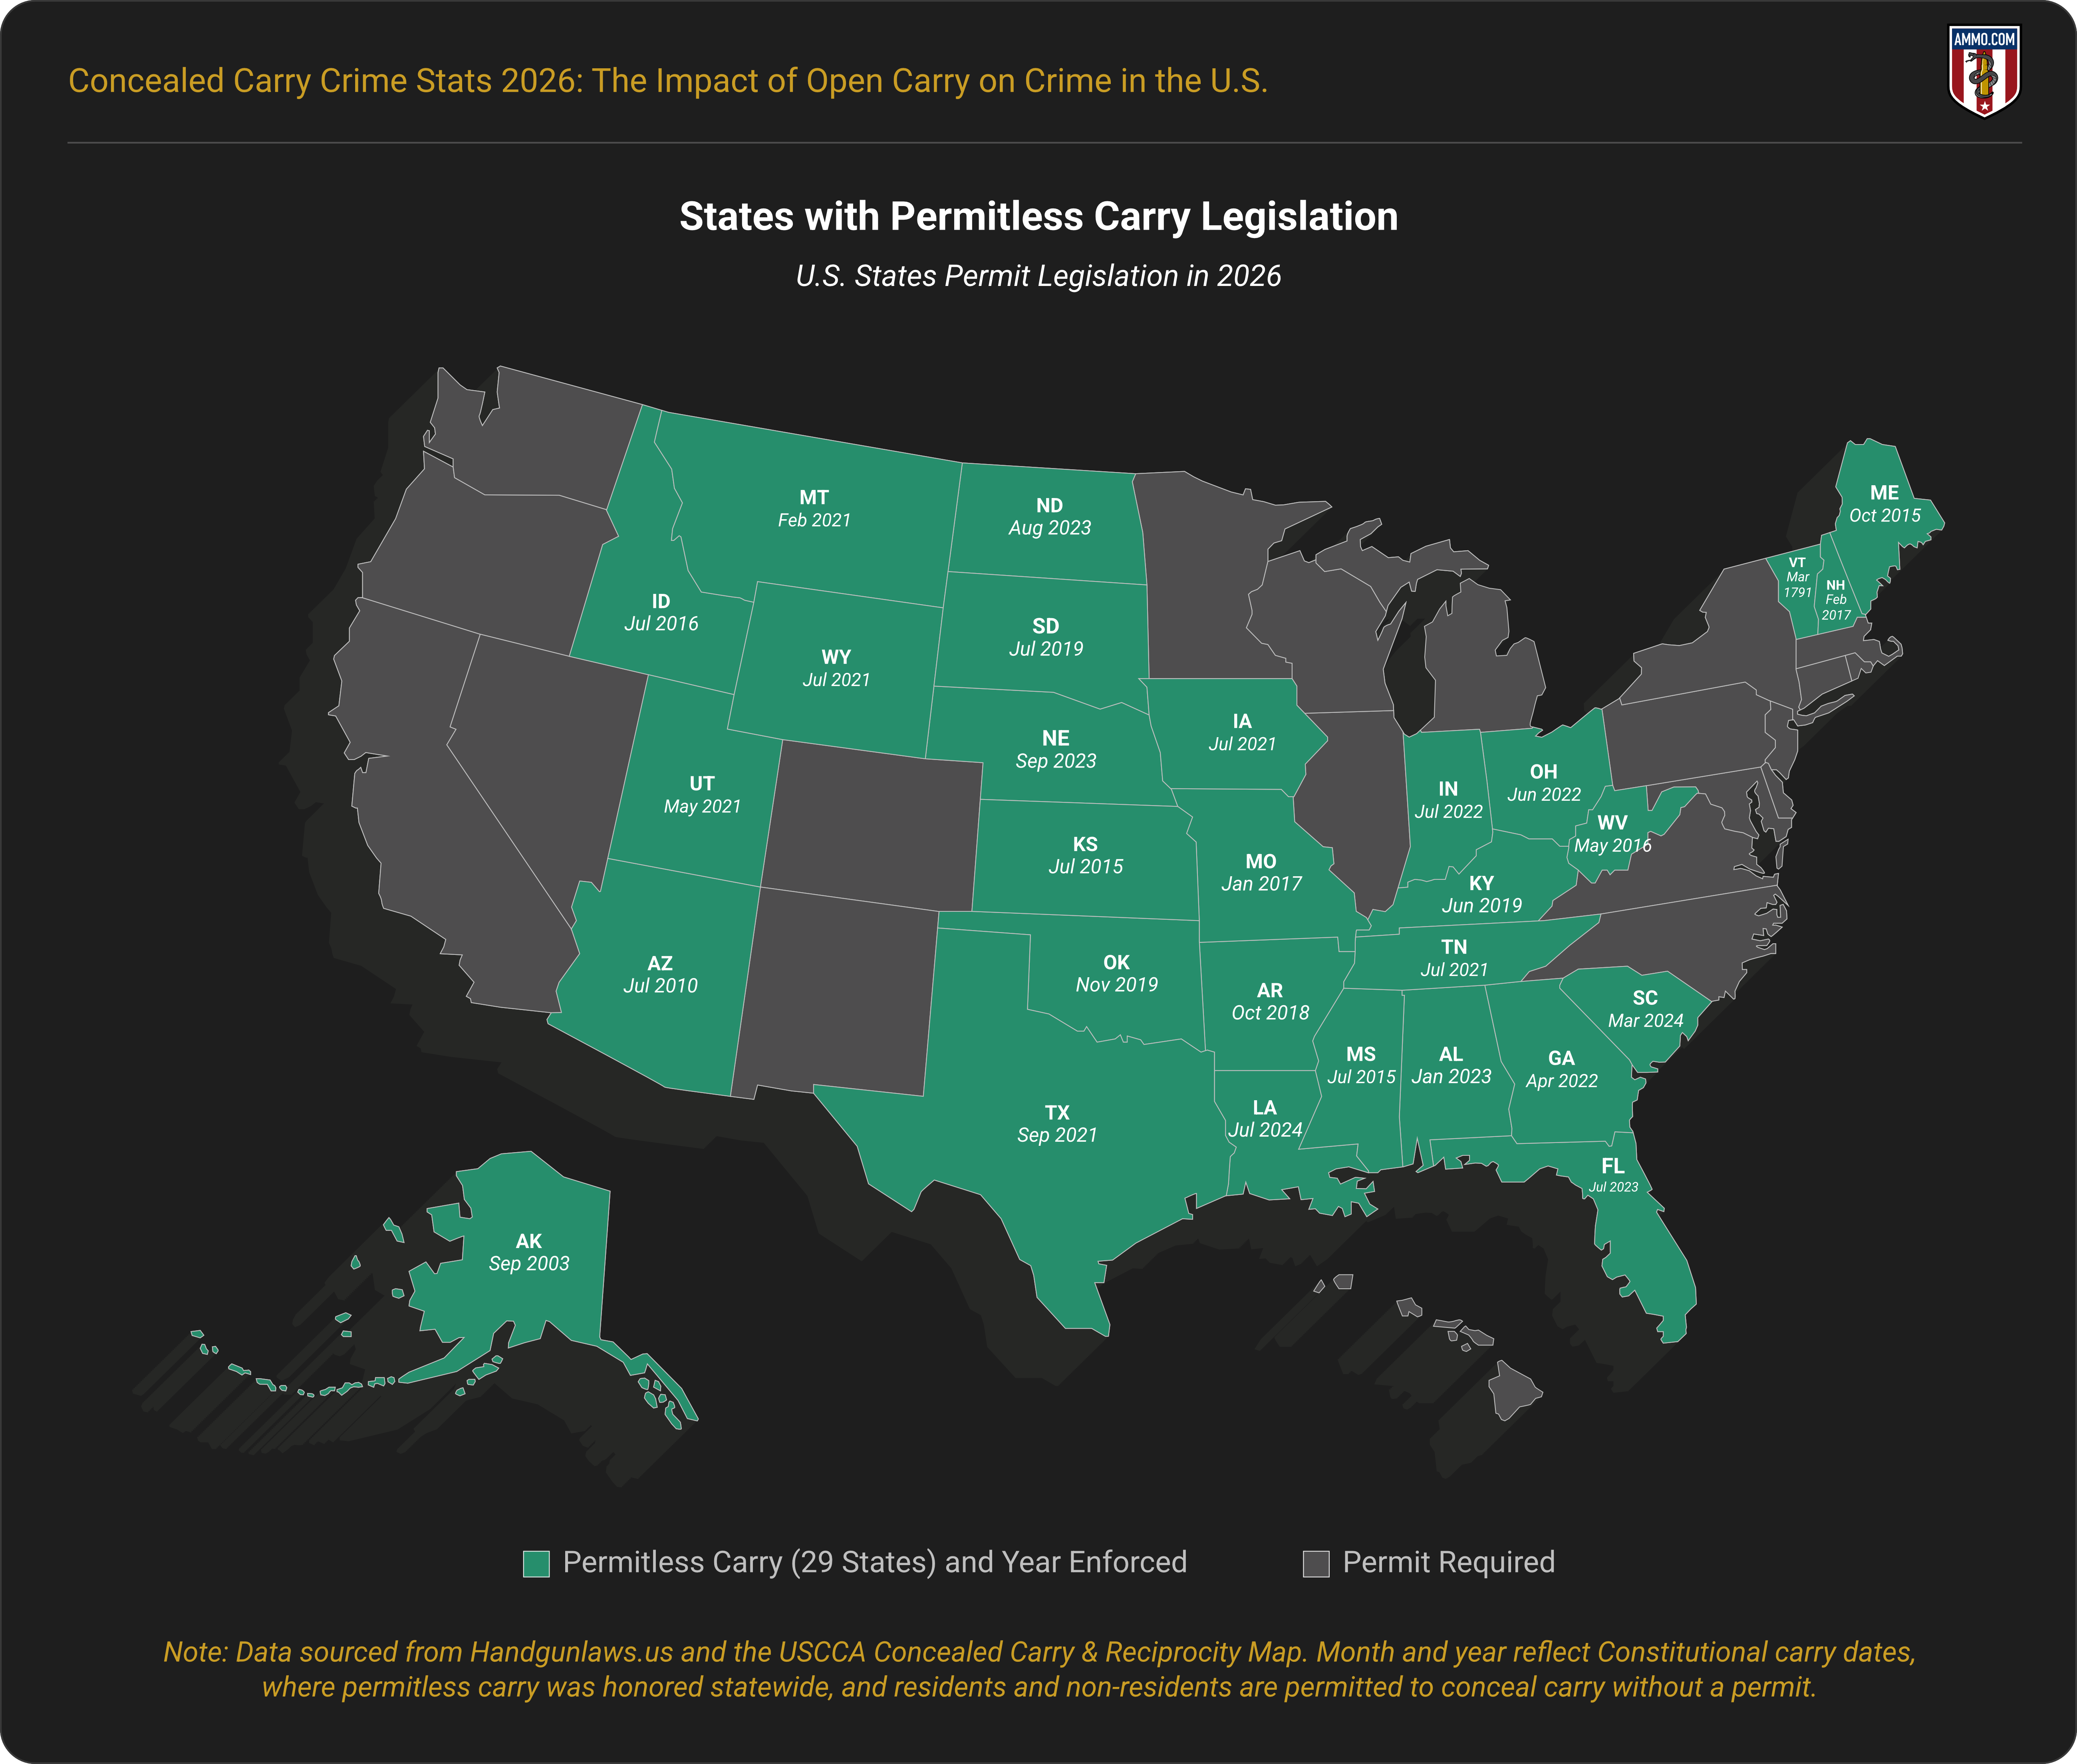
In 2026, 29 states have permitless concealed carry legislation. Vermont has never required a permit to carry8. Sixteen of the 29 states with permitless carry enacted laws to that effect during or after 2021.
Alaska, Arizona, Idaho, Kansas, Maine, Mississippi, Vermont, West Virginia, and Wyoming (residents only) have allowed permitless carry for over a decade, while Louisiana and South Carolina were the last states to adopt Constitutional carry legislation, taking effect in 2024.8
Does Concealed Carry Reduce Crime?
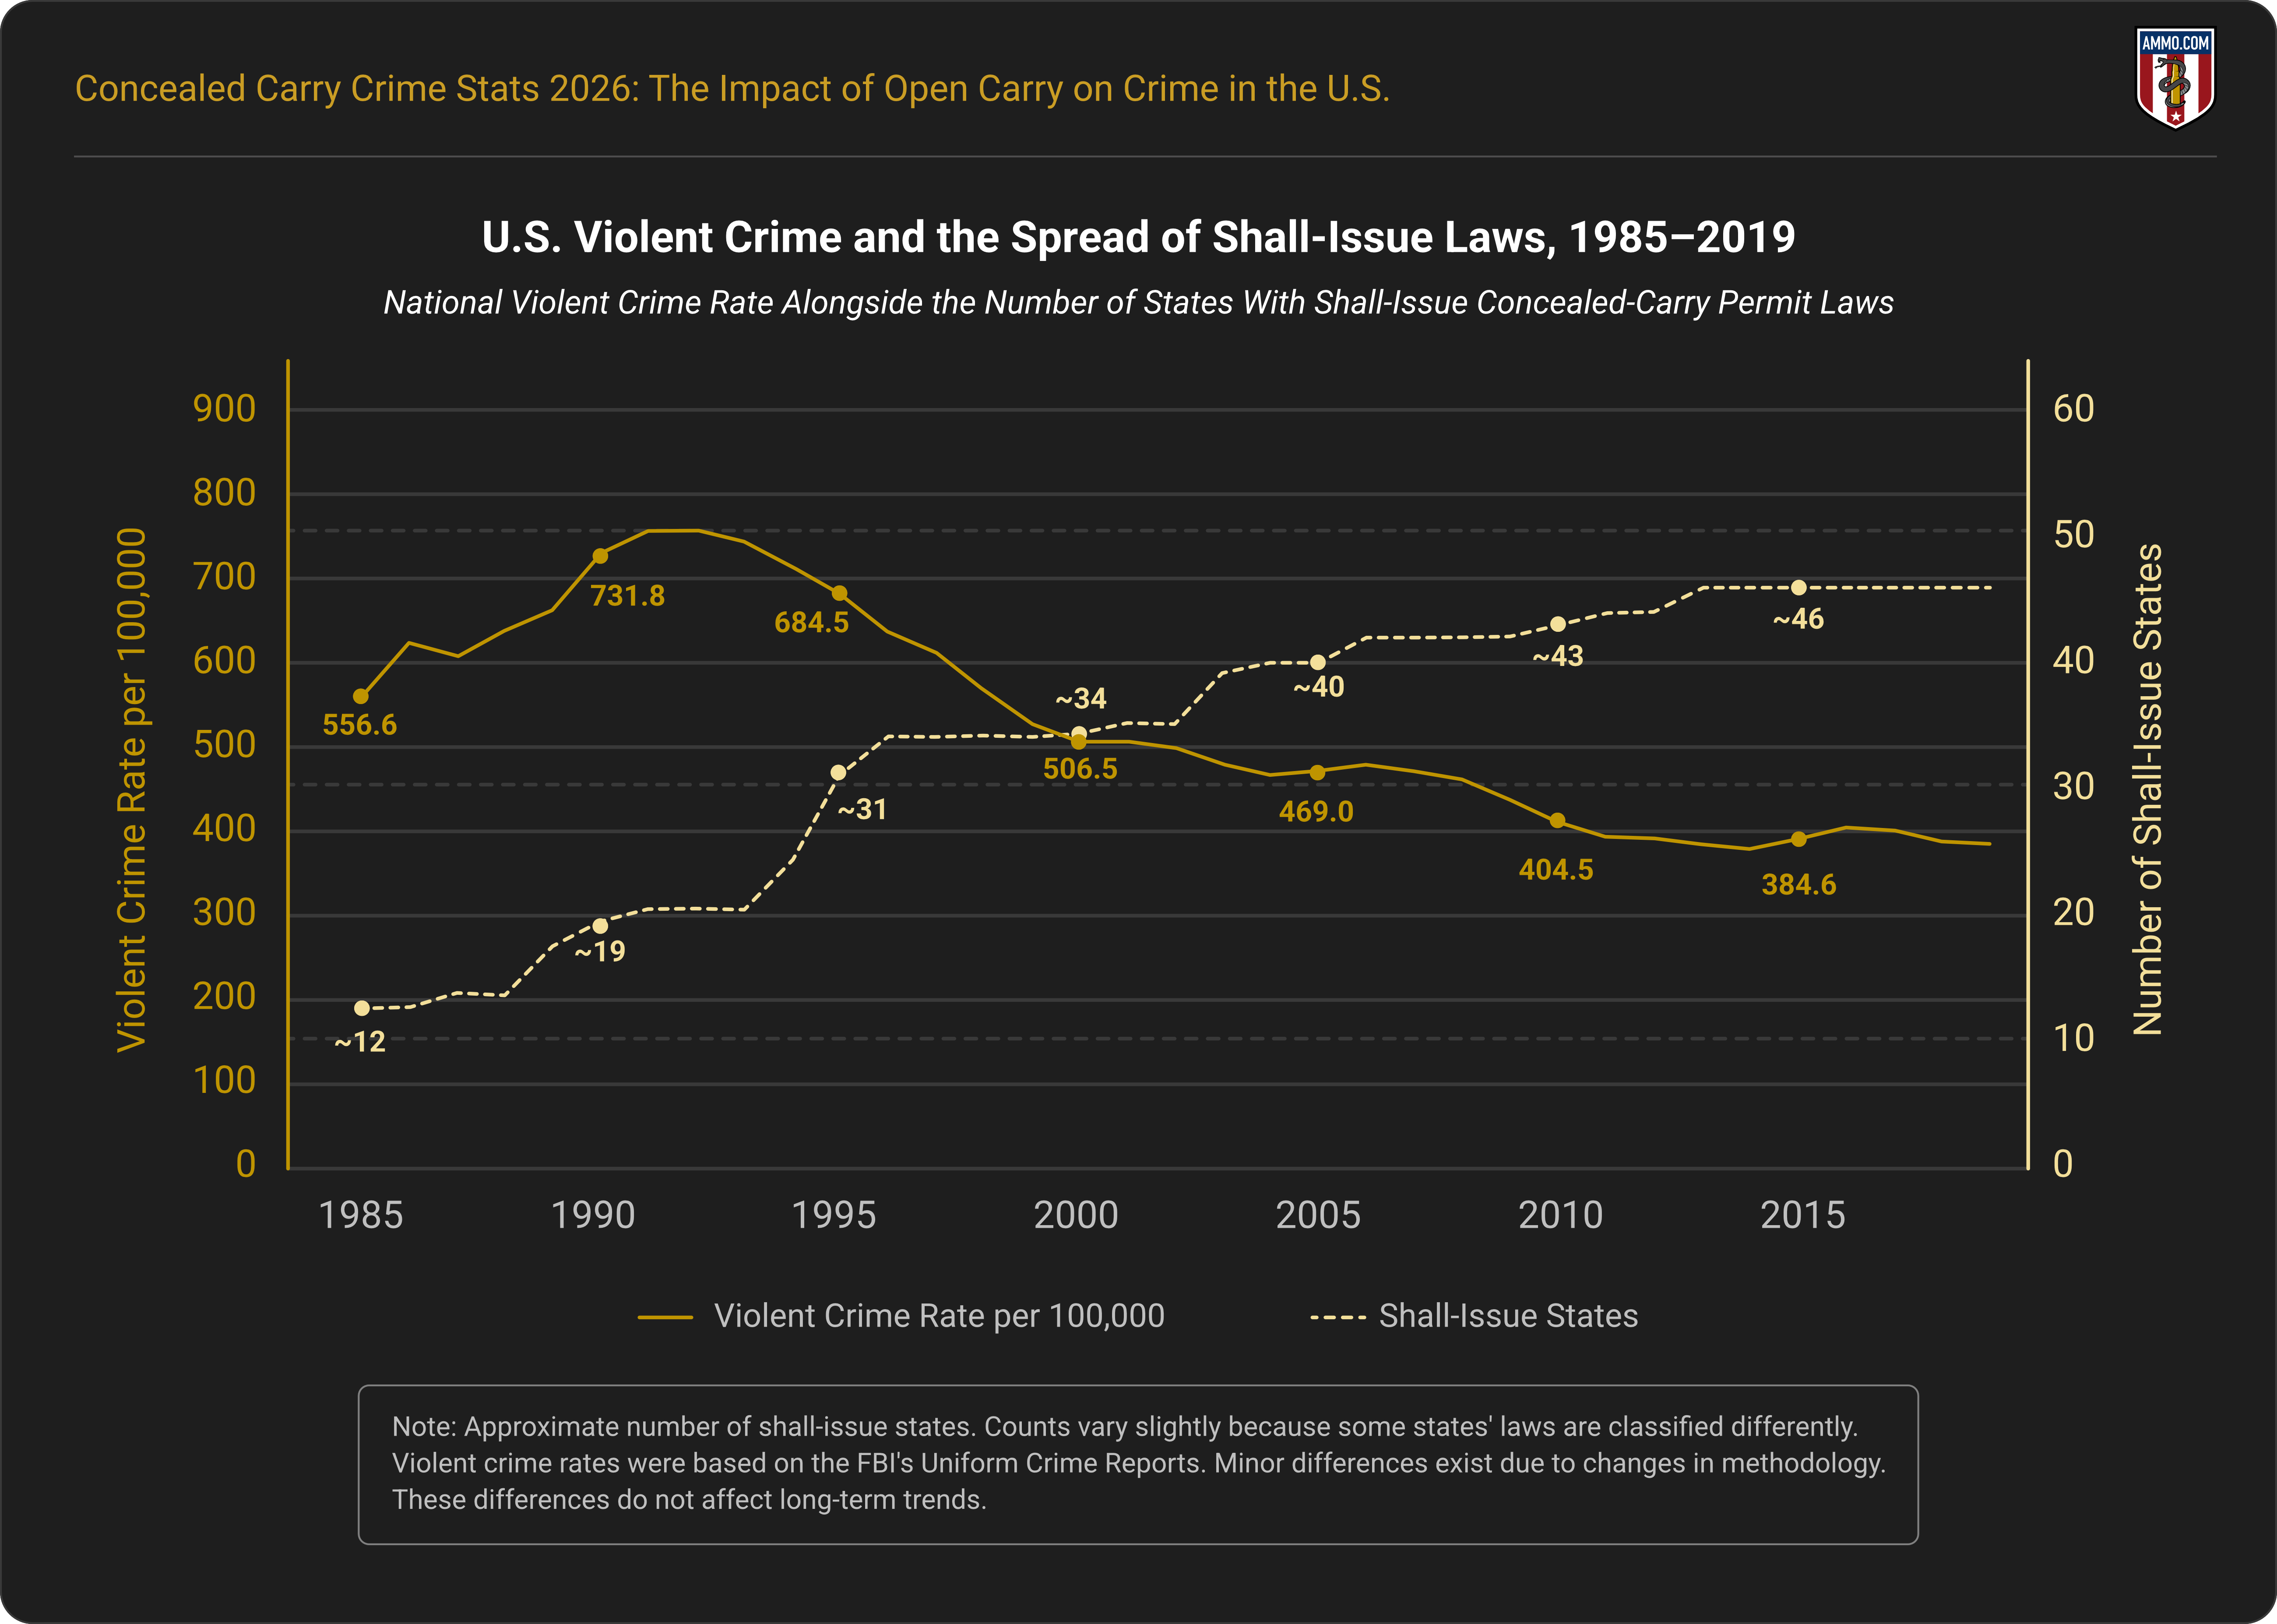
Civilian concealed carry legislation has no consistent relationship with violent crime. Before 1987, only ten states had right-to-carry laws, which allowed citizens to carry concealed firearms in public. By 1996, an additional 14 states had adopted policies allowing civilians to carry firearms in public. In 2013, there were 43 states with right-to-carry laws.10
National violent crime rates declined from a peak of 758.1 offenses per 100,000 people in 1991 to roughly 365 per 100,000 in 2014. Per the latest data at the time of writing, the violent crime rate in the U.S. was 359.1 per 100,000 in 2024.5, 6
In 2024, 55% of states with permitless carry had violent crime rates below the national average, while 57% of permit-required states were below the national average. The average violent crime rate among states with permitless carry was 311.9 per 100,000. The average rate among permit-required states was 335.1 per 100,000.3
4 Reasons Concealed Carry Is Argued to Be Bad
Concealed carry legislation varies by state. Violent crime and homicide trended downward when states began adopting “shall-issue” permit legislation in the 1990s, and continued trending downward as more states adopted permitless carry in the early 2020s.
1. Myth: Concealed Carry Increases Gun Violence
Per the latest available data, the states that enacted permitless carry before or during 2023 had a collective gun violence death rate of 5.0 per 100,000 people in 2024. States that required permits for concealed carry had a collective gun violence death rate of 4.8 per 100,000 people.1, 2, 3, 4
Of the six states that have had permitless carry for at least a decade, all but Alaska have either reported stable or reduced gun violence death rates. Vermont and Wyoming’s gun violence rates were unreliable in 2000 due to the CDC WONDER database’s suppression rules (i.e. low death totals are not calculated due to statistical volatility). Arizona and Kansas experienced reduced gun violence death rates from 2000 to 2019 (permitless carry legislation was passed in 2010 and 2015, respectively). Maine experienced a slight increase (permitless carry in 2015) of 0.1 per 100,000 in 2019.1, 2, 3, 4
Gun violence includes gun-related incidents where one person intentionally inflicts harm on another (e.g. murder, justifiable homicide, legal intervention, and operations of war). Gun violence rates reflect 2000 and 2019, as the national death rate spiked in 2020 and 2021, affecting most states.
2. Myth: Concealed Carry Presents Unnecessary Challenges for Law Enforcement
According to the National Police Association, armed civilians help police officers rather than hinder them. This organization argued that enforcing unconstitutional gun laws in Illinois actually presents unnecessary challenges to law enforcement.
One issue of concern is how concealed carry legislation affects officer safety. However, over a period of nearly four decades, when millions of Americans gained the legal right to carry firearms in public, felonious deaths of law enforcement officers actually declined in the U.S.8, 10, 11, 12
In 1987, 185 law enforcement officers were murdered in the line of duty.
In 1994, when 24 states had shall-issue carry permit legislation, 179 officers were murdered.
In 2005, when 40 states had shall-issue permit legislation, 168 officers were murdered.
In 2019, when 46 states had shall-issue permit laws, 169 officers were murdered.
In 2023, when 27 states allowed civilians to conceal carry without a permit, 162 officers were murdered.
In 2025, when 29 states allowed permitless carry, and 41 states had passed shall-issue permit legislation, only 109 on-duty officers were murdered.
3. Myth: Concealed Carry Poses Risk to Civilians in Sensitive Places
The effects of concealed carry on civilians in sensitive places are disputed, but armed civilians often act as defenders against threats. Data aren’t available to demonstrate that armed civilians are a threat to civilians in sensitive places. However, data do support the assertions that armed civilians act in defense more often than law enforcement officers, and criminals are unlikely to go through legal means to obtain firearms.
A 2016 report published by the Bureau of Justice Statistics shows that 1.3% of prison inmates who used a firearm during the commission of a crime purchased it from an FFL dealer. This suggests that few legal gun owners committed crimes with firearms.13
An FBI report published in 2025 showed that civilians made up a larger share of defenders in justifiable homicide cases than law enforcement officers between 2015 and 2024. This report suggests that 59% of all justifiable homicides were attributed to civilians, compared to 41% by law enforcement.15
Americans are conservatively estimated to use firearms defensively between 61,000 and 65,000 times per year (with some studies suggesting more than 1 million annually). National Crime Victimization Surveys over the past 35 years consistently show that Americans use firearms to stop a threat more often than they are murdered with them.14
4. Myth: Concealed Carry Legislation Increases Violent Crime
The weighted average violent crime rate for states with permitless carry legislation was 328.1 incidents per 100,000 people through 2024. Comparatively, states that required permits had a collective average violent crime rate of 327.3 per 100,000.3
Of the 12 states that passed permitless carry between 2019 and 2022, 11 had lower violent crime rates in 2024 than they did in 2019. Despite heightened national violent crime rates across the country in 2020 and 2021, Montana was the only state with new permitless carry legislation that experienced an increase in reported violent crime (418 to 423 per 100,000).3
Alternatively, most states with heightened violent crime rates during this period were permit-required states. California (+10%), Colorado (+24%), Kansas (+8%), Minnesota (+8%), Oregon (+13%), and Washington (+8%) all sustained higher violent crime rates after the 2020 COVID pandemic spike. Of these, Kansas was the only state with permitless concealed carry legislation.1, 4, 9
Open Carry States Crime Statistics
California, Florida, Illinois, and New York did not allow open carry of firearms under most circumstances in 2024 (Florida’s open carry restriction was repealed in 2025). Half of these states (California and New York) reported violent crime rates above the national average (359 incidents per 100,000 people) in 2024.7, 9
California - 486 per 100,000
Florida - 267 per 100,000
Illinois - 289 per 100,000
New York - 380 per 100,000
There were 31 permissive (i.e. no-permit-required) open-carry states in the U.S. in 2024. The collective average violent crime rate of permissive open-carry states in 2024 was 347.5 per 100,000. The collective average rate of restrictive open-carry states (including those requiring permits for open carry) was 345.1 per 100,000 in the same year.3, 7, 9
Note: Open carry laws vary by state. Some permissive states do have restrictions on open carry, permissible locations, and concealment in vehicles.
Wrap-Up
Concealed carry legislation is one of many factors that may contribute to increases or decreases in crime. States with permissive or restrictive concealed carry legislation have varying violent crime trends. Ultimately, the relationship between armed civilians and restrictive gun laws is not proven to impact crime rates one way or another.
Sources
- Concealed Carry and Reciprocityusconcealedcarry.com
- CDC WONDERwonder.cdc.gov
- FBI Crime Data Explorercde.ucr.cjis.gov
- 50-State Crime Dataprojects.csgjusticecenter.org
- Estimated Violent Crime Rate in the United States, 1979-2024ourworldindata.org
- United States Crime Rates 1960-2019disastercenter.com
- Permitless Carry Stateshandgunlaw.us
- What Is Open Carry and Which States Allow It?usconcealedcarry.com
- NRA: Concealed Carry | Right to Carrynraila.org
- Policing: By the Numberscounciloncj.org
- Levels and Changes in Defensive Firearm Use by US Crime Victims, 1987-2021ajph.aphapublications.org
- Justifiable Homicide, 2015-2024cde.ucr.cjis.gov

Infographics
- Are Guns & Ammo The New Gold? Why More Americans Are Arming Themselves
- The Greatest Gun Salesman In America: President Barack Obama
- Shooting Straight: How Both Presidential Candidates Have Changed On Gun Control
- President Obama: (Still) The Greatest Gun Salesman in America
- An Inconvenient Truth: How The Obama Administration Became Earth's Largest Arms Dealer
- Armed Drones: President Obama's Weapon of Choice
- COVID-19 Data Study: Ammunition Sales Continue to Soar in Response to Coronavirus Panic
- Data Study: 18 Months of Ammo Sales during a Pandemic, Protests, and the Biden Presidency
- Data Study: U.S. Ammo Sales Surge Following Russian Invasion of Ukraine
- Most Gun-Friendly States
- Worst States to be a Gun Owner
- Children & Firearms: Definitions and Demographics Make All the Difference
- Urban Violent Crime & Legal Gun Ownership
- Gun-Free School Zone Laws & School Shootings
- Gun Control Laws and Enforcement Trends
- Gun Ownership by State
- How Many Gun Owners are in America?
- Concealed Carry Crime Stats
- Accidental Shooting Statistics: A Review of Unintentional Firearm Deaths
- America's Stolen Guns: A Silent Contributor to Gun Crimes in the U.S.
- Gun Violence Statistics: Comprehensive Look at the Data
- Gun Laws vs. Crime Rates: A Comprehensive Analysis
- Gun Death Statistics by Caliber: A Review of Calibers and Crime
- Anti-Gun Control Arguments: Facts Gun Control Lobby Suppress
- Guns in the Home Statistics: The Effects of Firearms in the Home
- Gun Deaths in the US: Analyzing At-Risk Demographics
- How Many Guns in the U.S.: All About America's Firearms
- Gun Facts in the U.S.: The Reality of Firearms in America
- Defensive Gun Use Statistics: America's Life-Saving Gun Incidents
- Correlation Between Mass Shootings and Prescription Drugs
- Gun Ownership by Gender: Closing the Gender Gap
- Murders by Weapon Type: Statistics
- Gun Violence Among Black Americans: Statistics
- The Ultimate Hunting Caliber Chart: Best Cartridge Per Species
- How Old Do You Have to be to Buy a Gun: A State Guide
- Most Popular Guns in the U.S.: The Must-Have Guns
- Stray Bullet Deaths: Accident and Injury Statistics
- Mass Shooters by Race: Demographics of Assailants
- Ammunition Limits By State: How Much Ammo Can You Buy?
- Why Do Americans Own Guns?
- How Many Americans Want Stricter Gun Laws?
- How Many Households in the U.S. Have a Gun?
- What Percentage of Gun Deaths are Suicides?
- Average Age of Mass Shooters in the U.S.
- Firearm Ownership in America by Year
- US Firearms Deaths Per Year: A Collective Report
- Percentage of Americans Owning Guns
- Texas Gun Ownership: Total Numbers, Trends, and Most Popular Guns
- Gun Ownership Statistics Colorado: Trends & Numbers
- Hunting Accident Statistics (Causes & Trends Per Year)
- Banned Guns & Ammo List: A Review by State
- 3D Printed Gun Laws By State
- How To Build a Home Shooting Range: The Ultimate Guide
- States With the Highest Murder Rates
- Best Self-Defense Weapons for Women
- Easiest States to Buy a Gun
- Cities with the Lowest Crime Rate
- Oregon Homicide Rates
- Chicago Homicide Rate
- How Much Does a Suppressor Reduce Noise
- Texas Homicides: Statistics and Trends
- California Homicides: Rates Per 100K
- Florida Murder Rate: Statistics and Trends
- Gun Ownership by Political Party
- Mass Shooters by Gender
- U.S. Hunting and Fishing Statistics
- Where Are Silencers Illegal? State Suppressor Laws
- How Loud is a Gunshot?
- What States Have the Strictest Gun Control?
- Causes of Mass Shootings in the U.S.