Children, Firearm, & Gang-Related Deaths (2026 Statistics)
As of 2024, there were more than 73 million minors in the 0-17 age group. Of those, 2,228 (0.003%) suffered gun-related fatalities.
-
3.0 Per 100,000, tied with motor vehicles
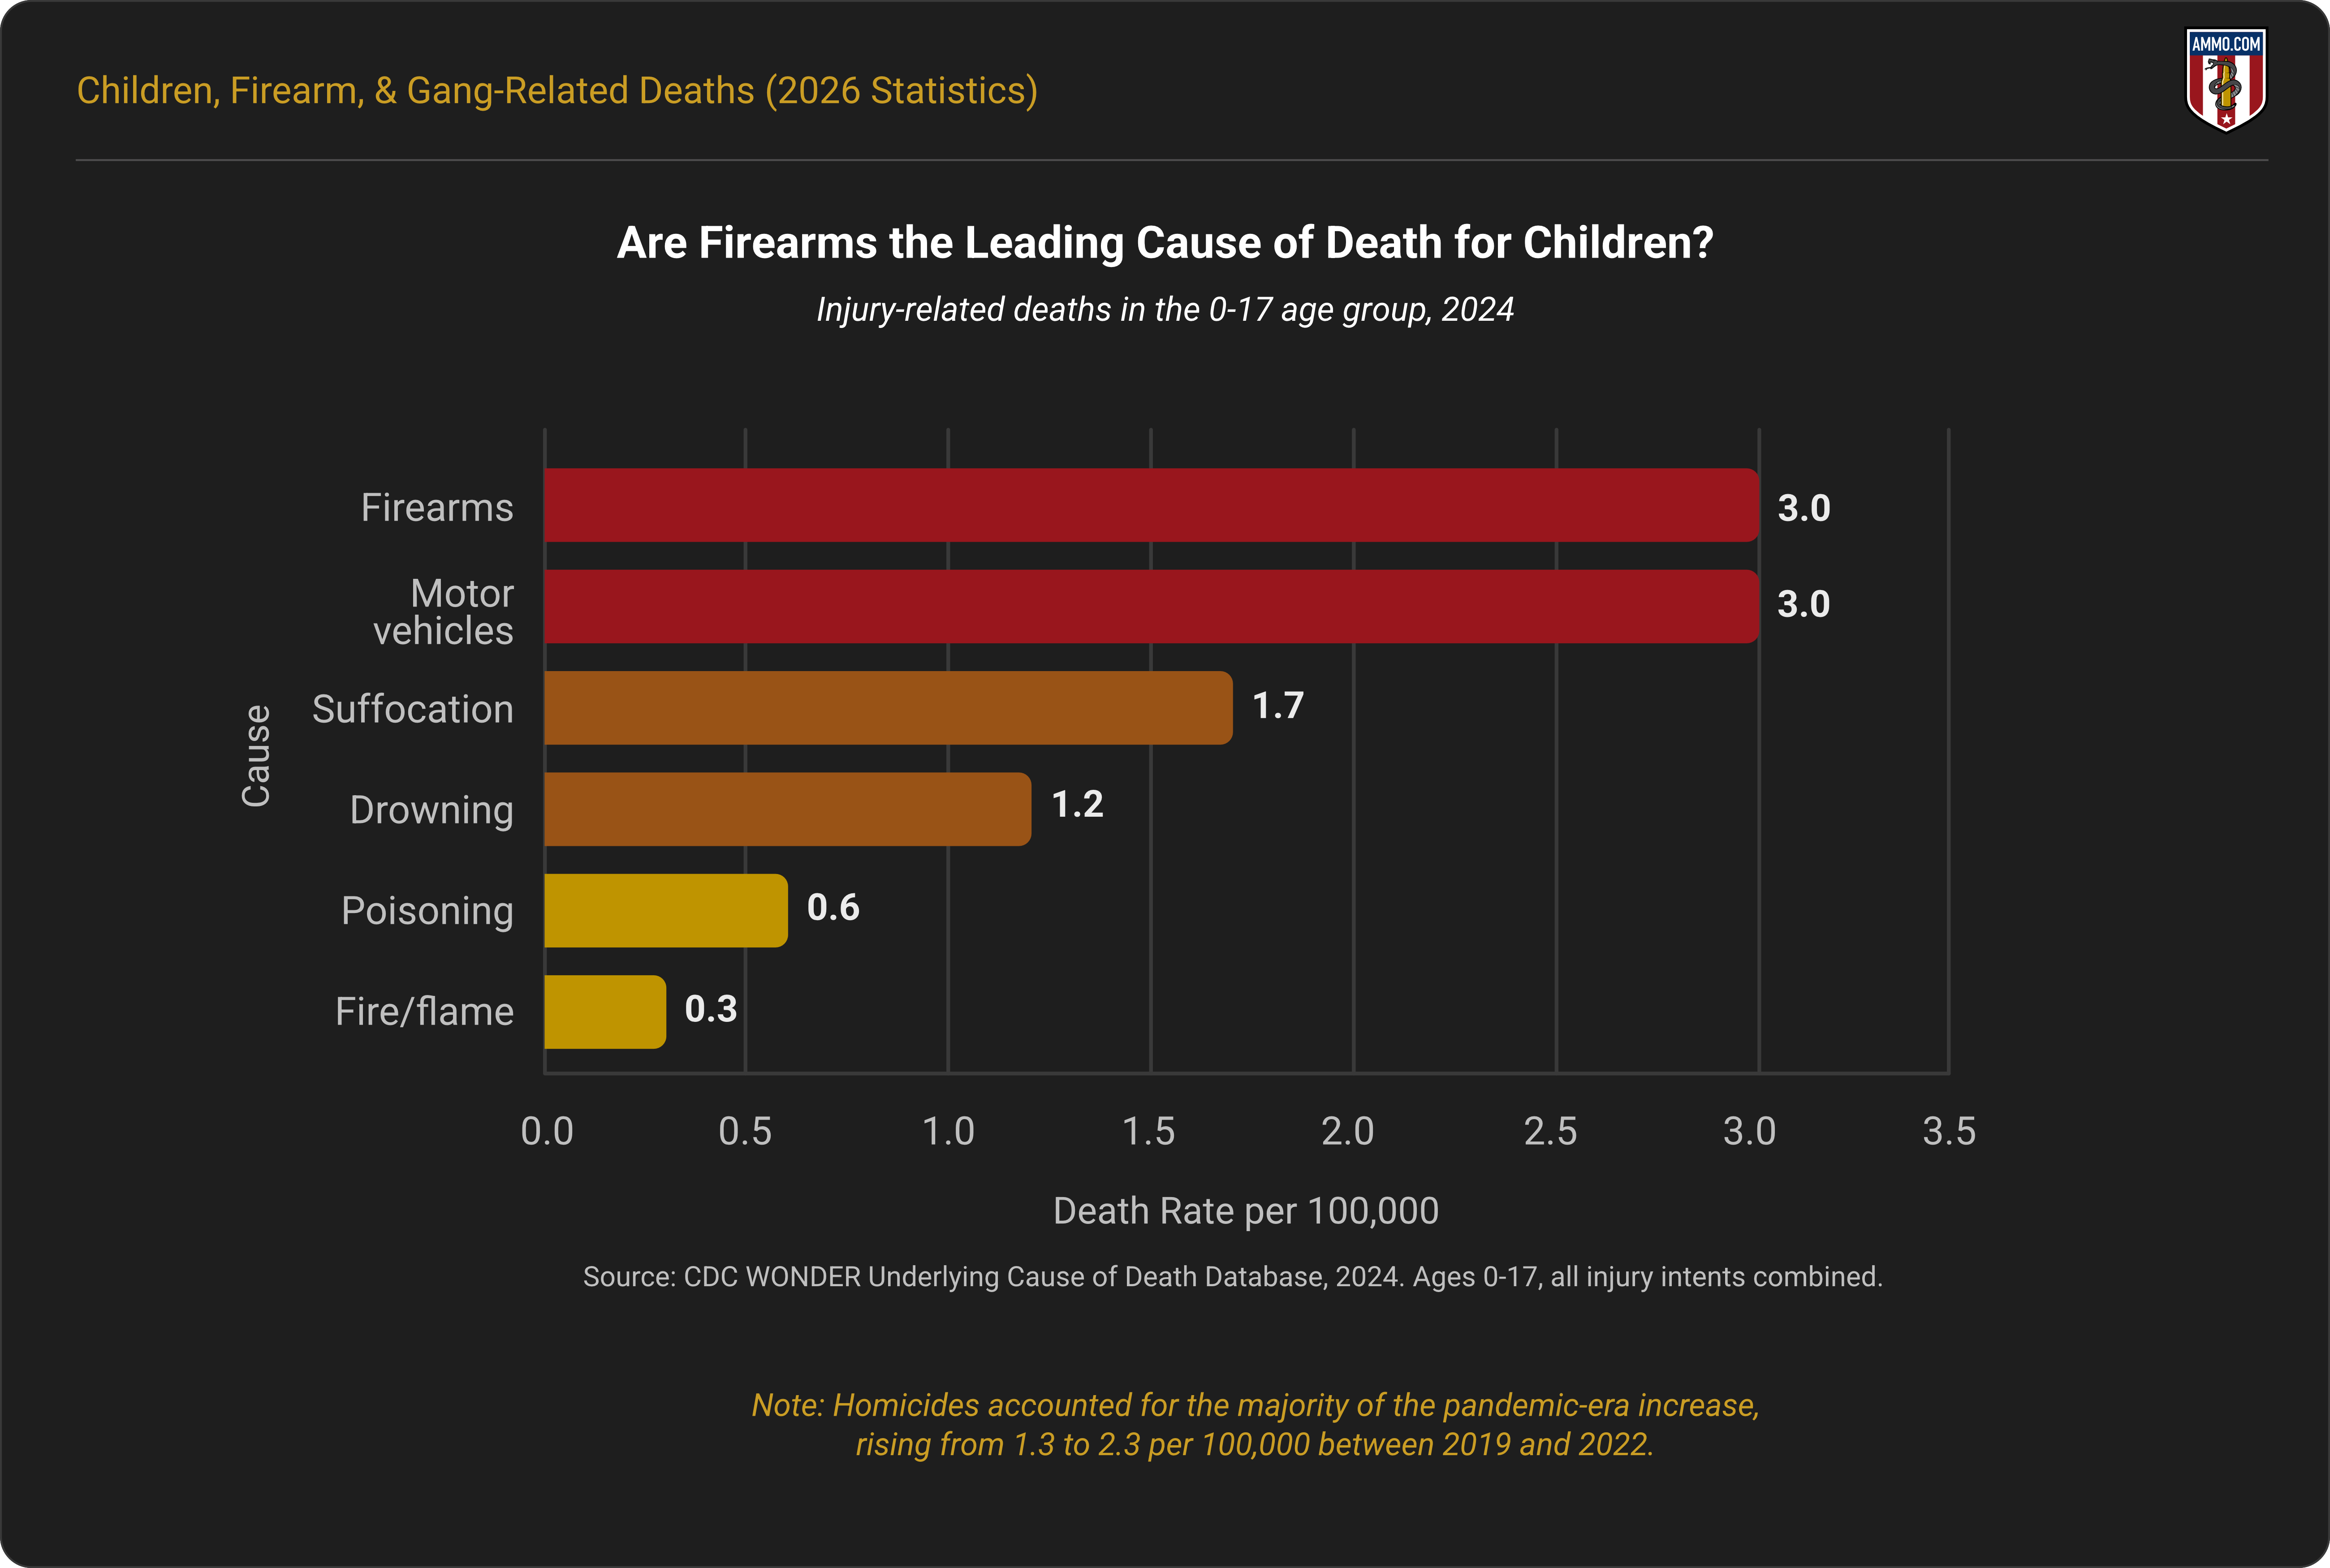
In 2024, firearms and motor vehicles tied as the leading cause of injury-related death in the 0-17 age group (3.0 per 100,000).
-
▲76.9% Homicides, 2019 to 2022
The pandemic-era spike in gun deaths among U.S. minors was primarily driven by homicides, which increased by 76.9% (1.3 to 2.3 per 100,000) from 2019 to 2022.
-
More than one-third of gang violence offenders and more than one-quarter of gang violence victims were under 18 years of age between 2021 and 2024.
Ammo.com provides accurate information from reputable sources. You can view the sources cited in this article.
Methodology
All firearm death data in this report were sourced from the CDC WONDER Underlying Cause of Death and CDC WONDER Provisional Mortality Statistics databases. Raw death counts, population size, and crude rates were obtained directly from the CDC WONDER database when available for the single-year age group (0-17).
Where noted, 2025 data are provided to show more recent trends, but these data are provisional at the time of writing. Death totals and rates will change as the database becomes more current.
Urban and rural deaths were classified using WONDER’s 2023 Urbanization categories. Population rates for the 0-17 age group by metropolitan statistical area (MSA) are unavailable in the WONDER database and in U.S. Census Bureau data. The data presented are a share of gun deaths by MSA, rather than adjusted for population.
Gang-related gun deaths are not consistently tracked or reported in the U.S. All gang-related data in this report are sourced from government sources and national surveys.
Are Firearms the Leading Cause of Death for Children?
In 2024, firearms and motor vehicles accounted for the highest rate of injury-related deaths in children and adolescents (0-17 age group) at 3.0 per 100,000.2
Although incomplete at the time of writing, data available in 2025 showed a 10% decline in the adolescent gun death rate (2.7 per 100,000) from 2024. Per the available data, motor vehicles were associated with 3.0 deaths per 100,000 in 2025.3
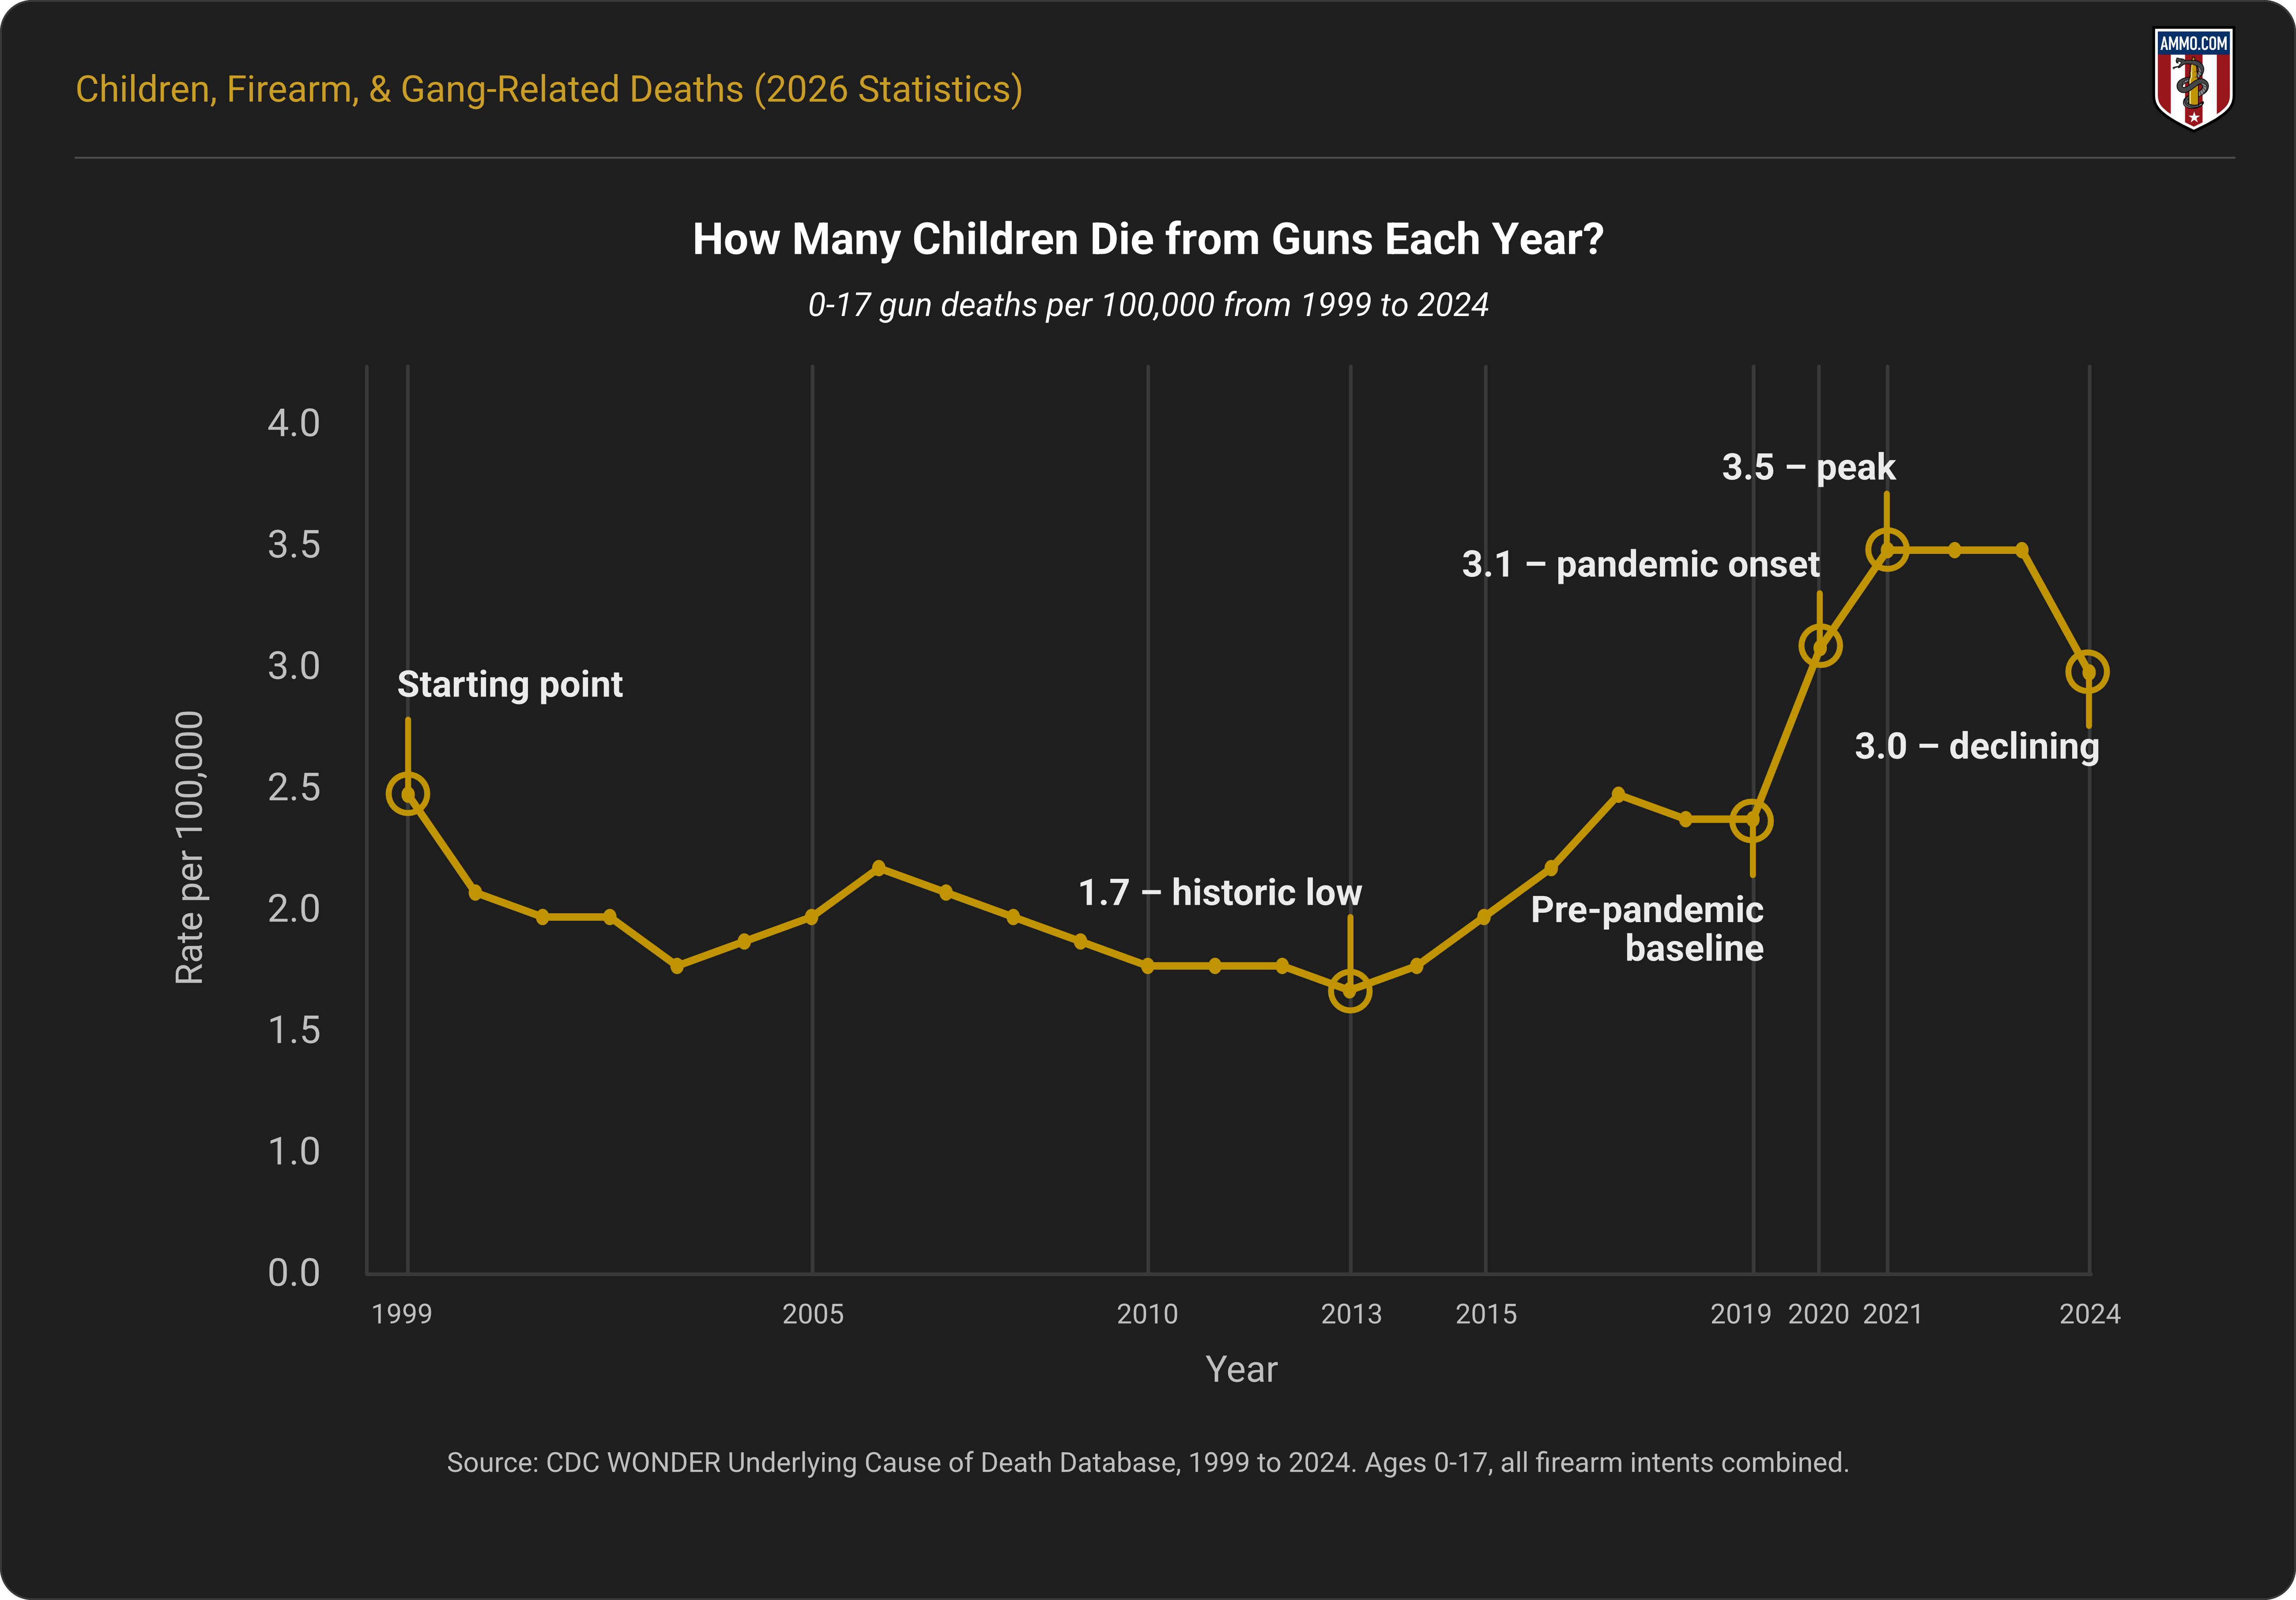
In 2018 and 2019, the gun death rate in the under-18 age group was 2.2 per 100,000. Gun deaths began increasing in 2020 (3.1 per 100,000) and remained at 3.5 per 100,000 from 2021 to 2023, before gradually declining to 3.0 in 2024 and 2.7 in 2025 (provisional).2
Homicides primarily drove the increase in gun deaths during and following the COVID pandemic. From 2019 to 2022, firearm-related homicides in this age group increased from 1.3 per 100,000 to 2.3 (76.9%). Firearm-related suicides remained at 0.9 per 100,000 before the pandemic and into 2022. Unintentional firearm-related deaths increased slightly from 0.1 per 100,000 in 2019 to 0.2 per 100,000 in 2022.2
How Many Children Die from Guns Each Year?
Between 1999 and 2019, an average of 1,489 (2.0 per 100,000) children and adolescents (0-17) died from gunshots. During and following the COVID pandemic, adolescent and child gun deaths increased by 50.4% to an average of 2,240 per year.2, 3, 8
The rate of gun deaths among the 0-17 age group spiked to 3.5 per 100,000 in 2021, 2022, and 2023. In 2024, gun death rates declined to 3.0 per 100,000. Preliminary 2025 data show the rate falling to 2.7 deaths per 100,000.2
Leading Cause of Death by Age Group (Birth to 17)
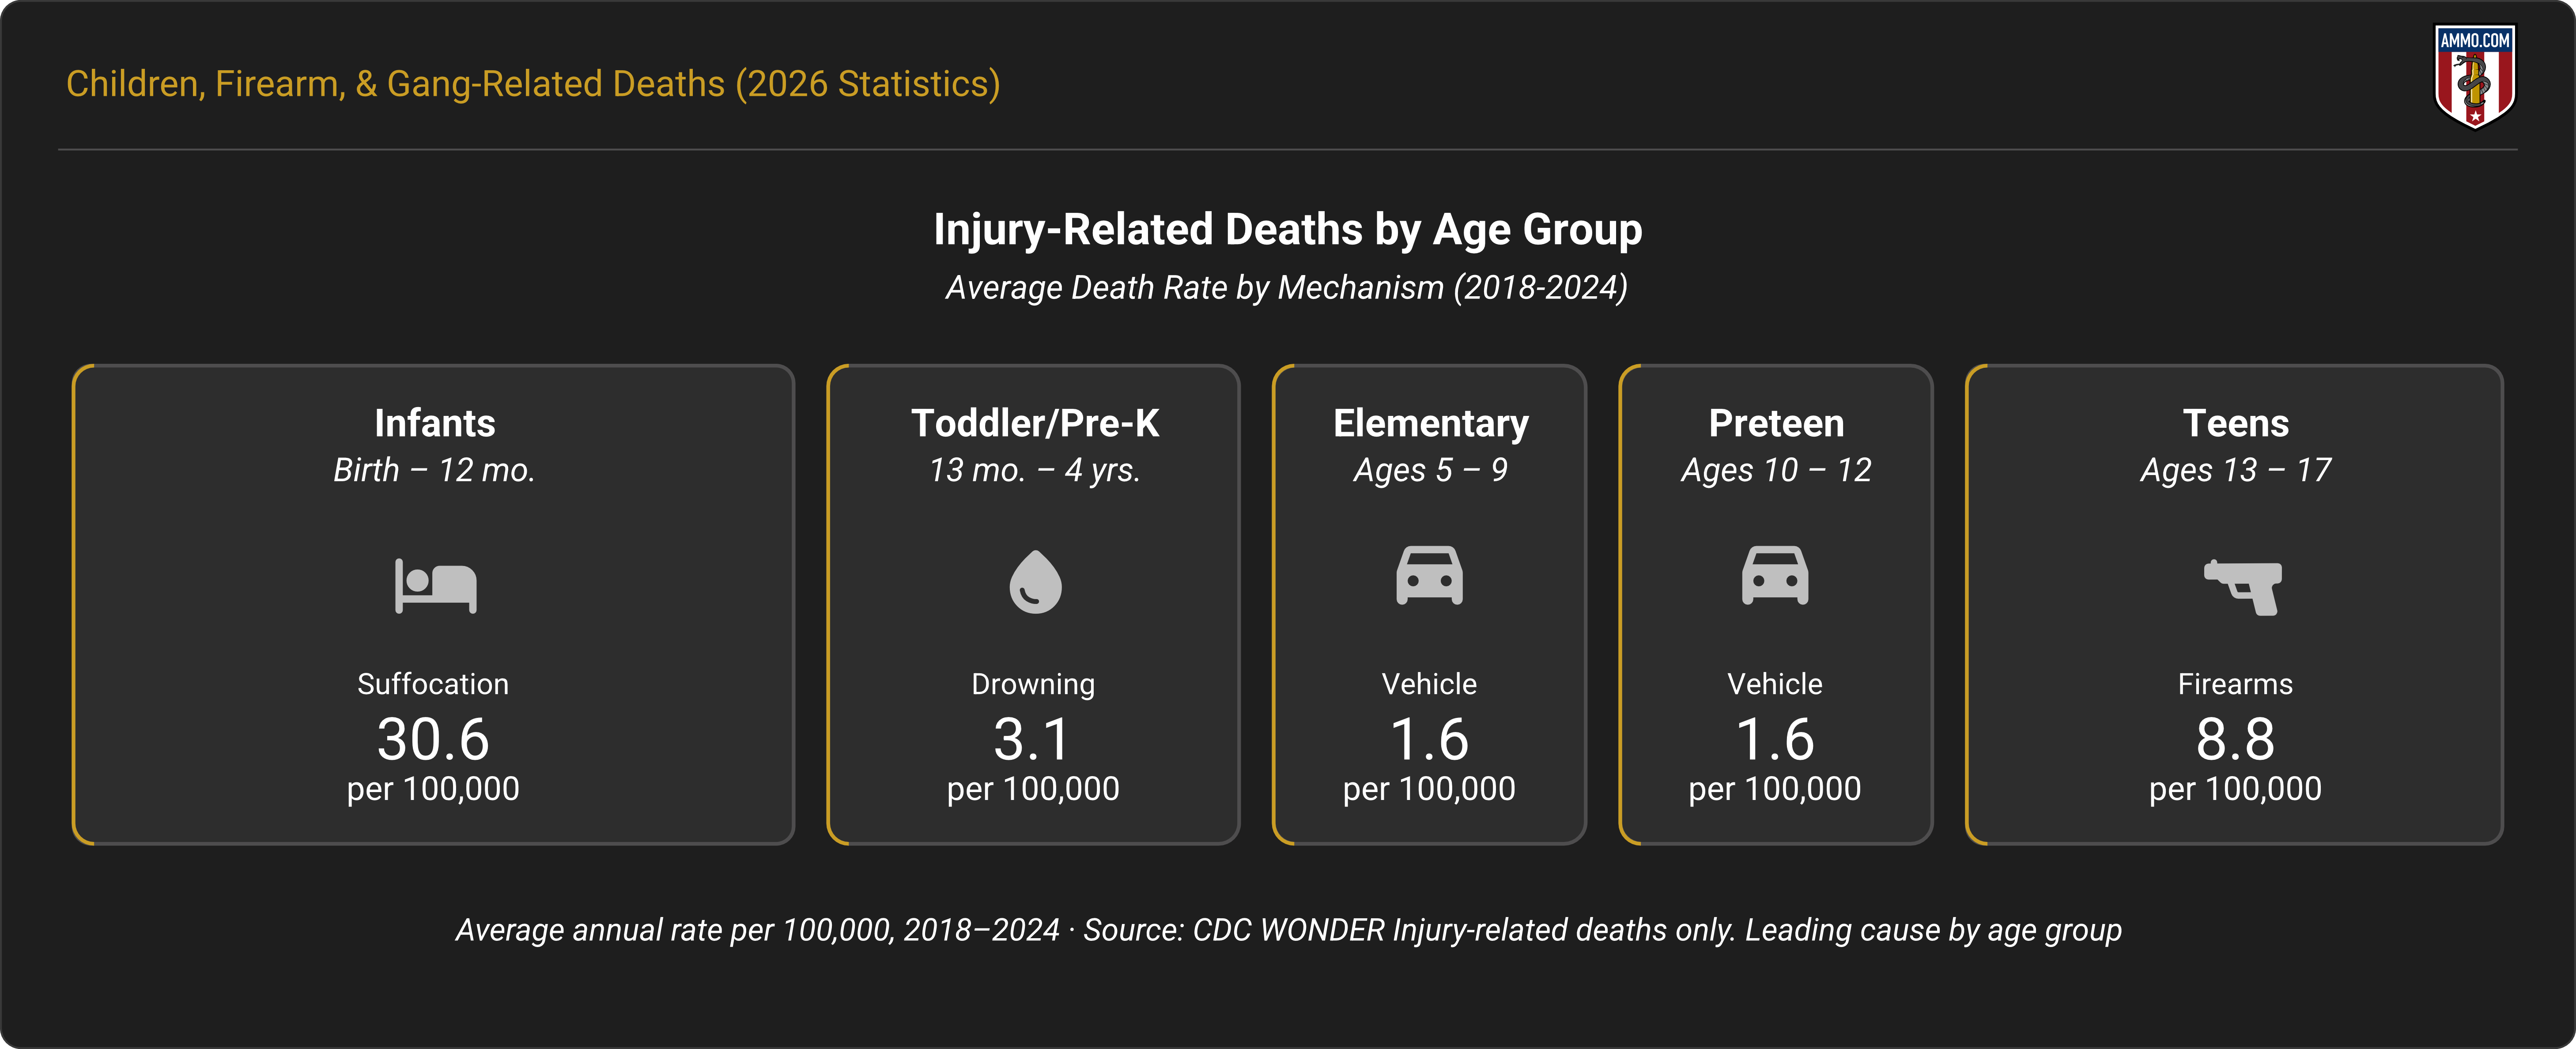
Infants, from birth to 12 months, had the highest average annual rate of injury-related deaths due to suffocation (30.6 per 100,000). Toddlers through pre-school-aged children died from drowning at a collective average rate of 3.1 per 100,000 from 2018 to 2024.
During that time period, elementary-aged children (5 to 9) and preteens (10 to 12) died from motor vehicle accidents at a rate of 1.6 per 100,000.
Teens (13 to 17) died from firearm-related deaths at an average rate of 8.8 per 100,000 from 2018 to 2024.2
For how the law treats this age bracket, see our state-by-state guide to the minimum age to purchase a gun.
Accidental Gun Deaths Statistics
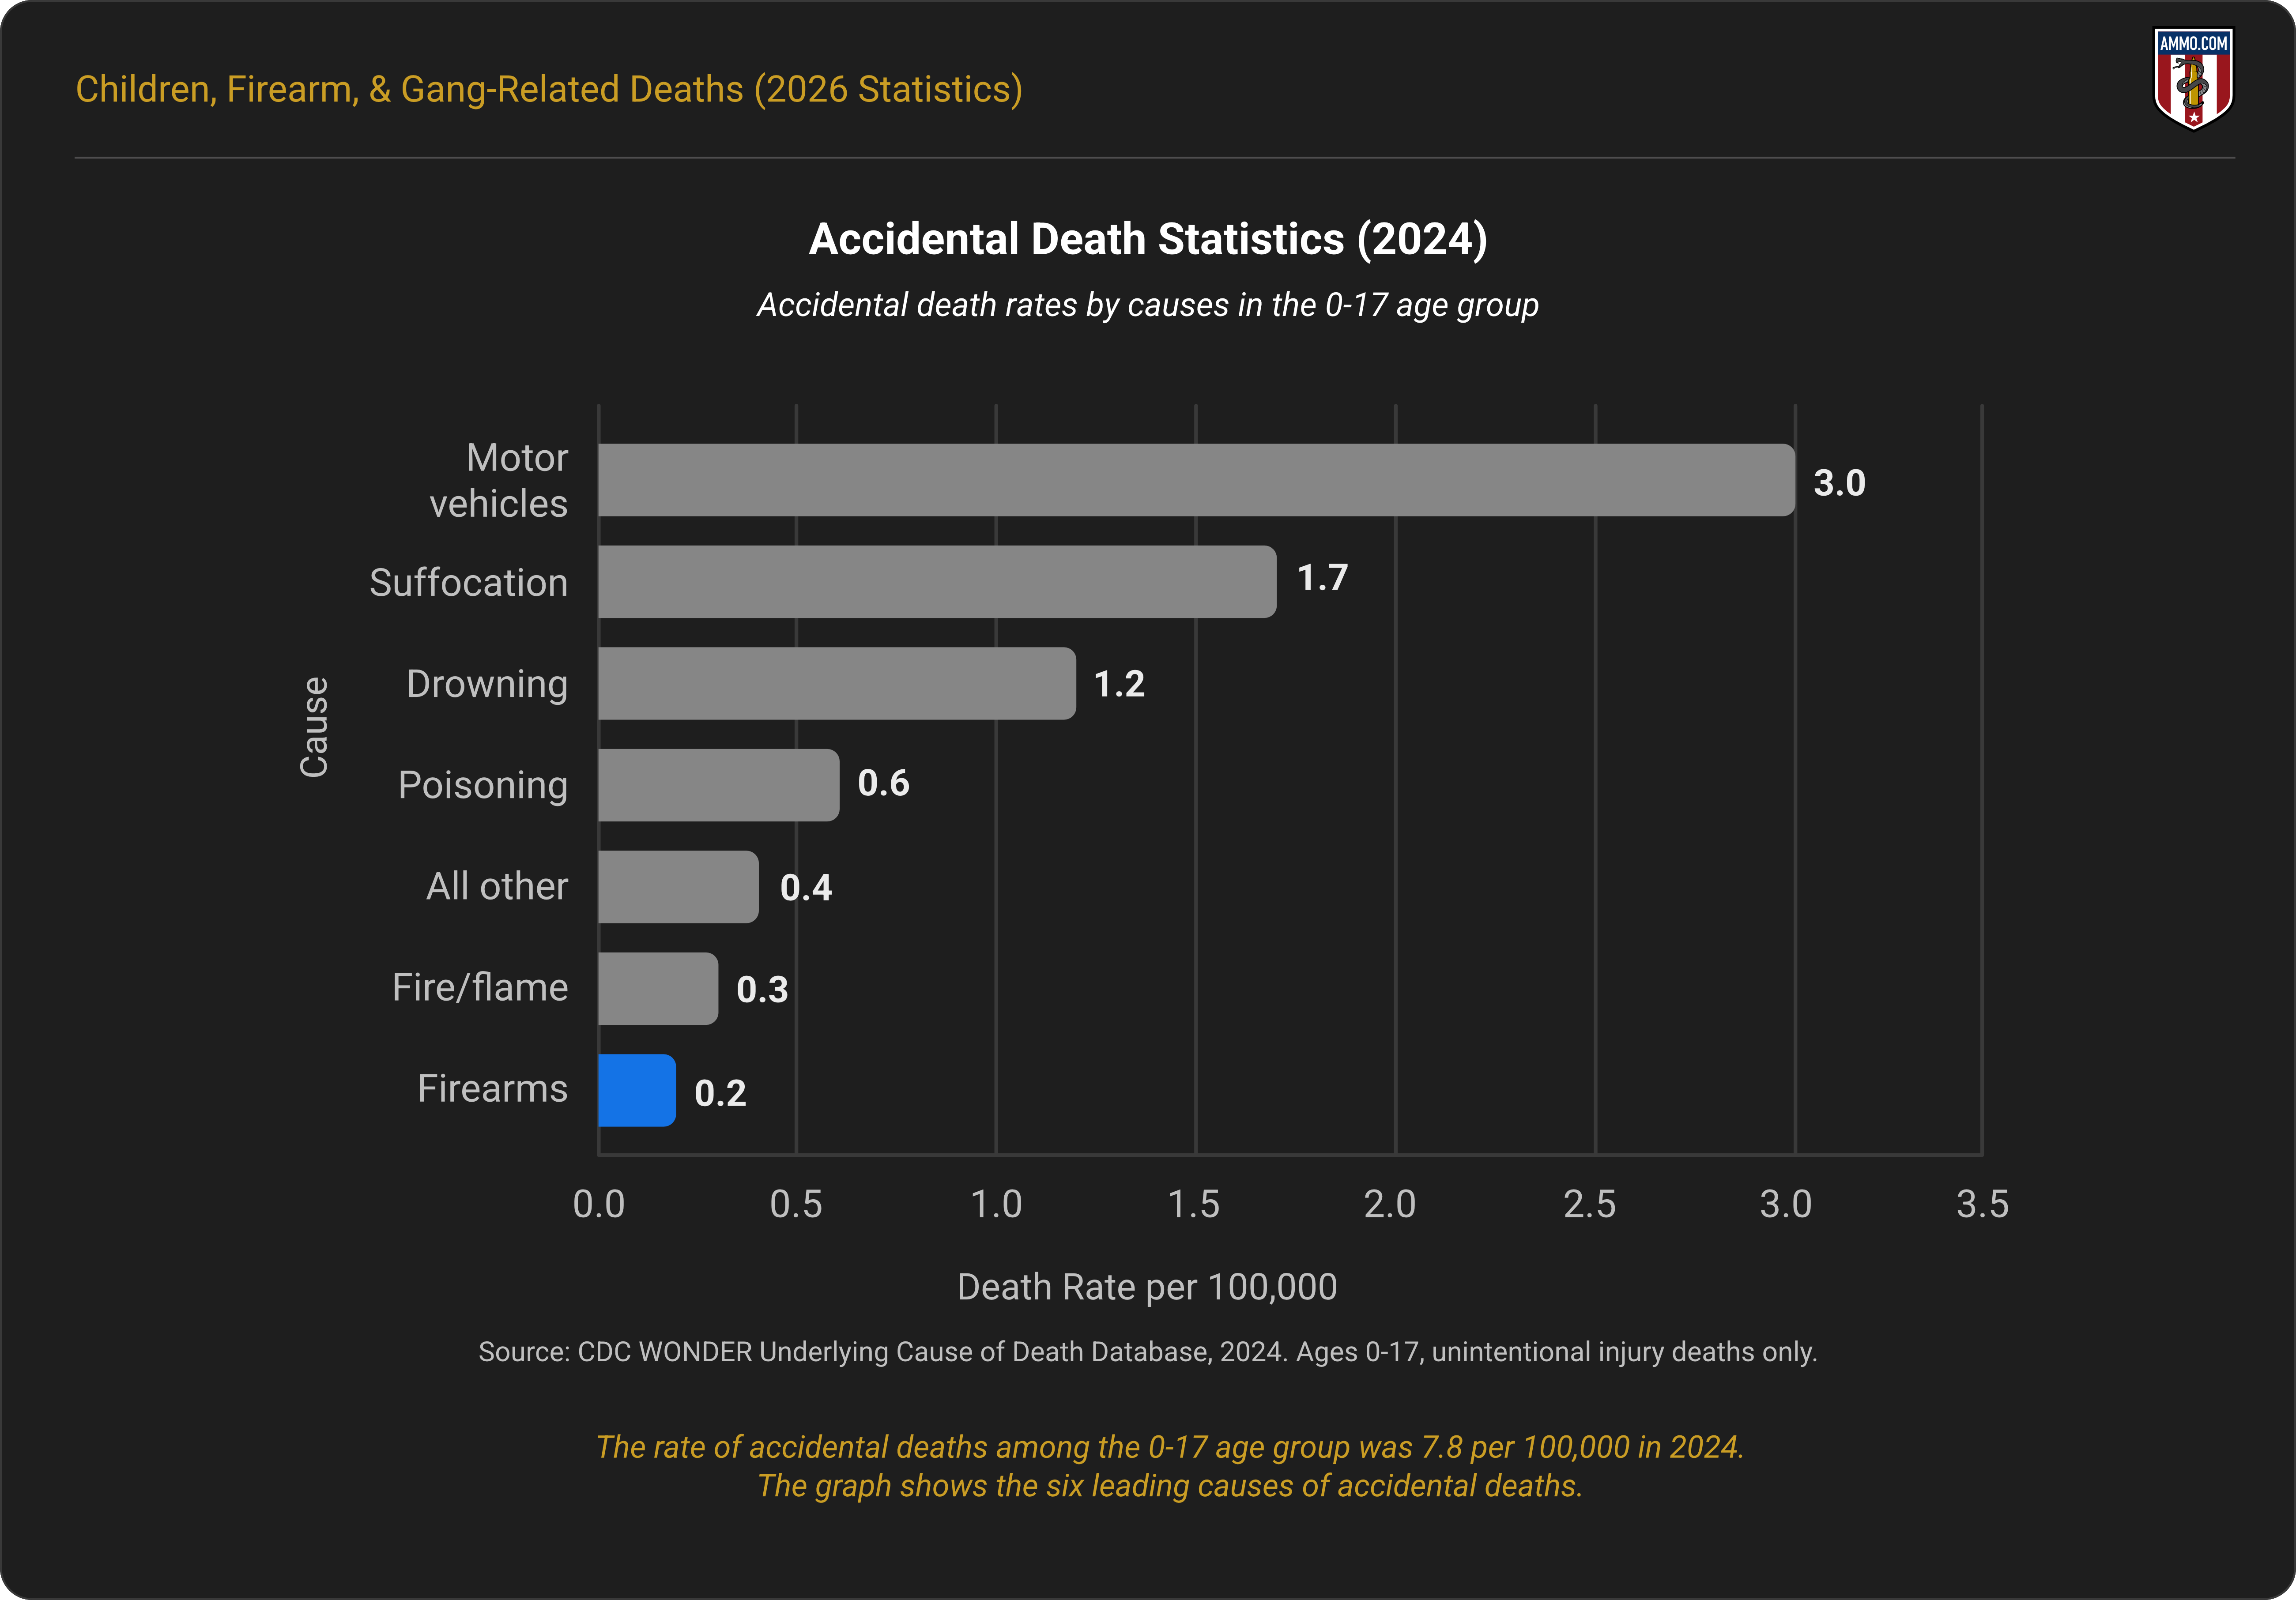
In 2024, children and adolescents died from accidental injuries at a rate of 7.8 per 100,000. Motor vehicles (3.0 per 100,000), suffocation (1.7 per 100,000), drowning (1.2 per 100,000), poisoning (0.6 per 100,000), and fire (0.3 per 100,000) were the most common mechanisms of death that year.2
Accidental gun deaths in the 0-17 age group are rare. There were 125 unintentional gun deaths among this group in 2024. This equates to 0.2 deaths per 100,000 in the age group.2
For a wider view of unintentional firearm deaths across every age group, see our review of accidental shooting statistics.
Urban and Rural Children's Firearm Deaths
Of the 2,175 gun deaths (0-17 age group) reported by MSA in 2024, more than one-third occurred in large central metros (35.6%). Medium-sized cities accounted for 21.1% of gun deaths. Large suburban areas accounted for 18.9% of all gun deaths, followed by micropolitan areas (8.9%), small metros (8.3%), and rural noncore areas (7.2%).2
Child-specific population estimates were unavailable for these MSAs, so per capita comparisons across these areas are not possible. What the data do reveal, however, is a striking difference in how children are dying from gun-related deaths depending on where they live.1
In 2024, homicide was the leading factor in gun-related deaths in large central metros (75.2%), medium-sized cities (63.7%), and large suburban areas (58.5%). Homicides accounted for less than half of all child and adolescent gun deaths in micropolitan areas (44.0%), small cities (43.1%), and rural noncore areas (34.4%).2
Alternatively, suicides were the leading factor in gun-related deaths in more rural areas. Suicides in noncore rural areas accounted for most gun deaths (54.8%), and nearly half of all gun deaths in smaller cities (49.2%) and micropolitan areas (45.6%). Suicides were a factor in 38.0% of gun deaths in large suburban areas and 29.1% of deaths in medium-sized cities. Suicides were rarely attributed to gun deaths in large central metros (16.9%).2
Accidental gun deaths were more common in noncore rural areas (10.8%), micropolitan areas (10.4%), small cities (7.7%), and medium-sized cities (7.2%) than in large central metros (3.5%) or large suburban areas (3.4%).2
Our analysis of what percentage of gun deaths are suicides breaks the split down across all age groups.
Children Gun Deaths by Age
In 2024, gun deaths among 0-11-year-olds remained at or below 1 per 100,000. Twelve-year-olds experienced slightly higher gun death rates than their younger peers (1.4 per 100,000).2
From there, gun death rates become much higher for every age, with 13-year-olds dying at 3 per 100,000; 14-year-olds, 5.1 per 100,000; 15-year-olds, 8.8 per 100,000, 16-year-olds, 11.1 per 100,000; and 17-year-olds at a significantly higher rate of 14.5 per 100,000.2
For the same demographic breakdown across all ages rather than minors alone, see our report on gun deaths in America.
Gang-Related Gun Deaths Under 18 Statistics
Gang-related gun deaths for the 0-17 age group are challenging to track due to reporting and monitoring issues. Many law enforcement jurisdictions do not report gang-related crimes, and those that do may misidentify gang members.
Although the exact correlation between gang membership and gun deaths among the 0-17 age group is unknown, we can analyze trends in gang membership. In 2010, there were an estimated 1,059,000 youth gang members in the U.S. Of those, the peak age for membership was 14 years, which is also the age when gun deaths increased to 5.1 per 100,000 in 2024.2, 7
A National Gang Center survey conducted between 1996 and 2012 stated that of the jurisdictions reporting, law enforcement agencies in cities with populations over 100,000 had the highest incident rate of gang problems, which is consistent with our previous findings of homicides in urban MSAs.5, 6
Between 2021 and 2024, the U.S. Department of Justice reported that more than one-quarter (25.8%) of gang-violence victims and more than one-third (33.8%) of offenders who committed gang-related crimes were minors. More than half (53.7%) of gang-related crime incidents were violent crimes (murder, aggravated assault, rape, and robbery). Firearms were used in 39.3% of incidents where a weapon was used in the crime.4
Wrap-Up
Infant, child, and adolescent gun deaths are an unfortunate problem in the U.S. Gun death rates among young Americans vary depending on age and location. Suicides, homicides, and unintentional deaths also vary dramatically depending on rural versus urban environments.
Gang-related gun deaths aren’t widely tracked or monitored in the U.S., but some correlations exist between location and age.
Readers looking for prevention guidance can start with our guide to youth gun safety.
Sources
-
CDC WONDER: Underlying Cause of Death 2018-2024wonder.cdc.gov
-
U.S. Department of Justice: Gang Activity, 2021-2024cde.ucr.cjis.gov
-
National Youth Gang Survey Analysis: Measuring the Extent of Gang Problemsnationalgangcenter.ojp.gov
-
U.S. Department of Justice: Gang Statisticsjustice.gov
-
Gang membership between ages 5 and 17 years in the United Statespubmed.ncbi.nlm.nih.gov
-
CDC WONDER: Underlying Cause of Death, 1999-2020wonder.cdc.gov

Infographics
- Are Guns & Ammo The New Gold? Why More Americans Are Arming Themselves
- The Greatest Gun Salesman In America: President Barack Obama
- Shooting Straight: How Both Presidential Candidates Have Changed On Gun Control
- President Obama: (Still) The Greatest Gun Salesman in America
- An Inconvenient Truth: How The Obama Administration Became Earth's Largest Arms Dealer
- Armed Drones: President Obama's Weapon of Choice
- COVID-19 Data Study: Ammunition Sales Continue to Soar in Response to Coronavirus Panic
- Data Study: 18 Months of Ammo Sales during a Pandemic, Protests, and the Biden Presidency
- Data Study: U.S. Ammo Sales Surge Following Russian Invasion of Ukraine
- Most Gun-Friendly States
- Worst States to be a Gun Owner
- Children & Firearms: Definitions and Demographics Make All the Difference
- Urban Violent Crime & Legal Gun Ownership
- Gun-Free School Zone Laws & School Shootings
- Gun Control Laws and Enforcement Trends
- Gun Ownership by State
- How Many Gun Owners are in America?
- Concealed Carry Crime Stats
- Accidental Shooting Statistics: A Review of Unintentional Firearm Deaths
- America's Stolen Guns: A Silent Contributor to Gun Crimes in the U.S.
- Gun Violence Statistics: Comprehensive Look at the Data
- Gun Laws vs. Crime Rates: A Comprehensive Analysis
- Gun Death Statistics by Caliber: A Review of Calibers and Crime
- Anti-Gun Control Arguments: Facts Gun Control Lobby Suppress
- Guns in the Home Statistics: The Effects of Firearms in the Home
- Gun Deaths in the US: Analyzing At-Risk Demographics
- How Many Guns in the U.S.: All About America's Firearms
- Gun Facts in the U.S.: The Reality of Firearms in America
- Defensive Gun Use Statistics: America's Life-Saving Gun Incidents
- Correlation Between Mass Shootings and Prescription Drugs
- Gun Ownership by Gender: Closing the Gender Gap
- Murders by Weapon Type: Statistics
- Gun Violence Among Black Americans: Statistics
- The Ultimate Hunting Caliber Chart: Best Cartridge Per Species
- How Old Do You Have to be to Buy a Gun: A State Guide
- Most Popular Guns in the U.S.: The Must-Have Guns
- Stray Bullet Deaths: Accident and Injury Statistics
- Mass Shooters by Race: Demographics of Assailants
- Ammunition Limits By State: How Much Ammo Can You Buy?
- Why Do Americans Own Guns?
- How Many Americans Want Stricter Gun Laws?
- How Many Households in the U.S. Have a Gun?
- What Percentage of Gun Deaths are Suicides?
- Average Age of Mass Shooters in the U.S.
- Firearm Ownership in America by Year
- US Firearms Deaths Per Year: A Collective Report
- Percentage of Americans Owning Guns
- Texas Gun Ownership: Total Numbers, Trends, and Most Popular Guns
- Gun Ownership Statistics Colorado: Trends & Numbers
- Hunting Accident Statistics (Causes & Trends Per Year)
- Banned Guns & Ammo List: A Review by State
- 3D Printed Gun Laws By State
- How To Build a Home Shooting Range: The Ultimate Guide
- States With the Highest Murder Rates
- Best Self-Defense Weapons for Women
- Easiest States to Buy a Gun
- Cities with the Lowest Crime Rate
- Oregon Homicide Rates
- Chicago Homicide Rate
- How Much Does a Suppressor Reduce Noise
- Texas Homicides: Statistics and Trends
- California Homicides: Rates Per 100K
- Florida Murder Rate: Statistics and Trends
- Gun Ownership by Political Party
- Mass Shooters by Gender
- U.S. Hunting and Fishing Statistics
- Where Are Silencers Illegal? State Suppressor Laws
- How Loud is a Gunshot?
- What States Have the Strictest Gun Control?
- Causes of Mass Shootings in the U.S.
- Ammo Manufacturers List
- How Criminals Get Guns