Gun Ownership by Political Party: A 2026 Analysis
Report Highlights:
-
Republicans are 2.25 times more likely to own firearms than Democrats.
-
Independent voters reported 29% ownership rate in 2000 and 2023, lower than Republicans and higher than Democrats.
-
Republican women are 14% more likely to own guns than Democrat men.
-
Protection is the main reason for gun ownership across all political parties.
Related Studies: Gun Ownership by State | Firearm Ownership in America | Most Gun-Friendly States
Methodology
Gun ownership data were drawn from nationally representative surveys conducted by Pew Research Center, Gallup, the General Social Survey, and YouGov between 2000 and 2024.
Figures reflect self-reported, personal firearm ownership among voters who identified as Democrats, Republicans, or independents. Where only household data were available, this is noted. Trend comparisons used consistent question wording across survey years.
Gun Ownership by Political Party in 2025
According to surveys in 2024, Republicans are 2.5 times more likely to own firearms than Democrats.1, 2, 4, 5
Nearly half (45%) of Republican voters stated they own a firearm, while less than one quarter (20%) of Democrats said the same.
What Percentage of Democrats Own Guns?
In 2024, 20% of Democrat voters reported owning firearms, making them the voter group least likely to own firearms.
What Percentage of Republicans Own Guns?
In 2024, 45% of Republican voters reported owning firearms. Republicans were 2.25 times more likely to own guns than Democrats, and 1.55 times more likely to own guns than independents.
What Percentage of Independents Own Guns?
Between 2019 and 2024, 29% of independents reported owning firearms. Independent voters reported a spike in ownership in 2013, with some surveys showing rates as high as 44%.
Gun Ownership by Political Party: Trends Over Time
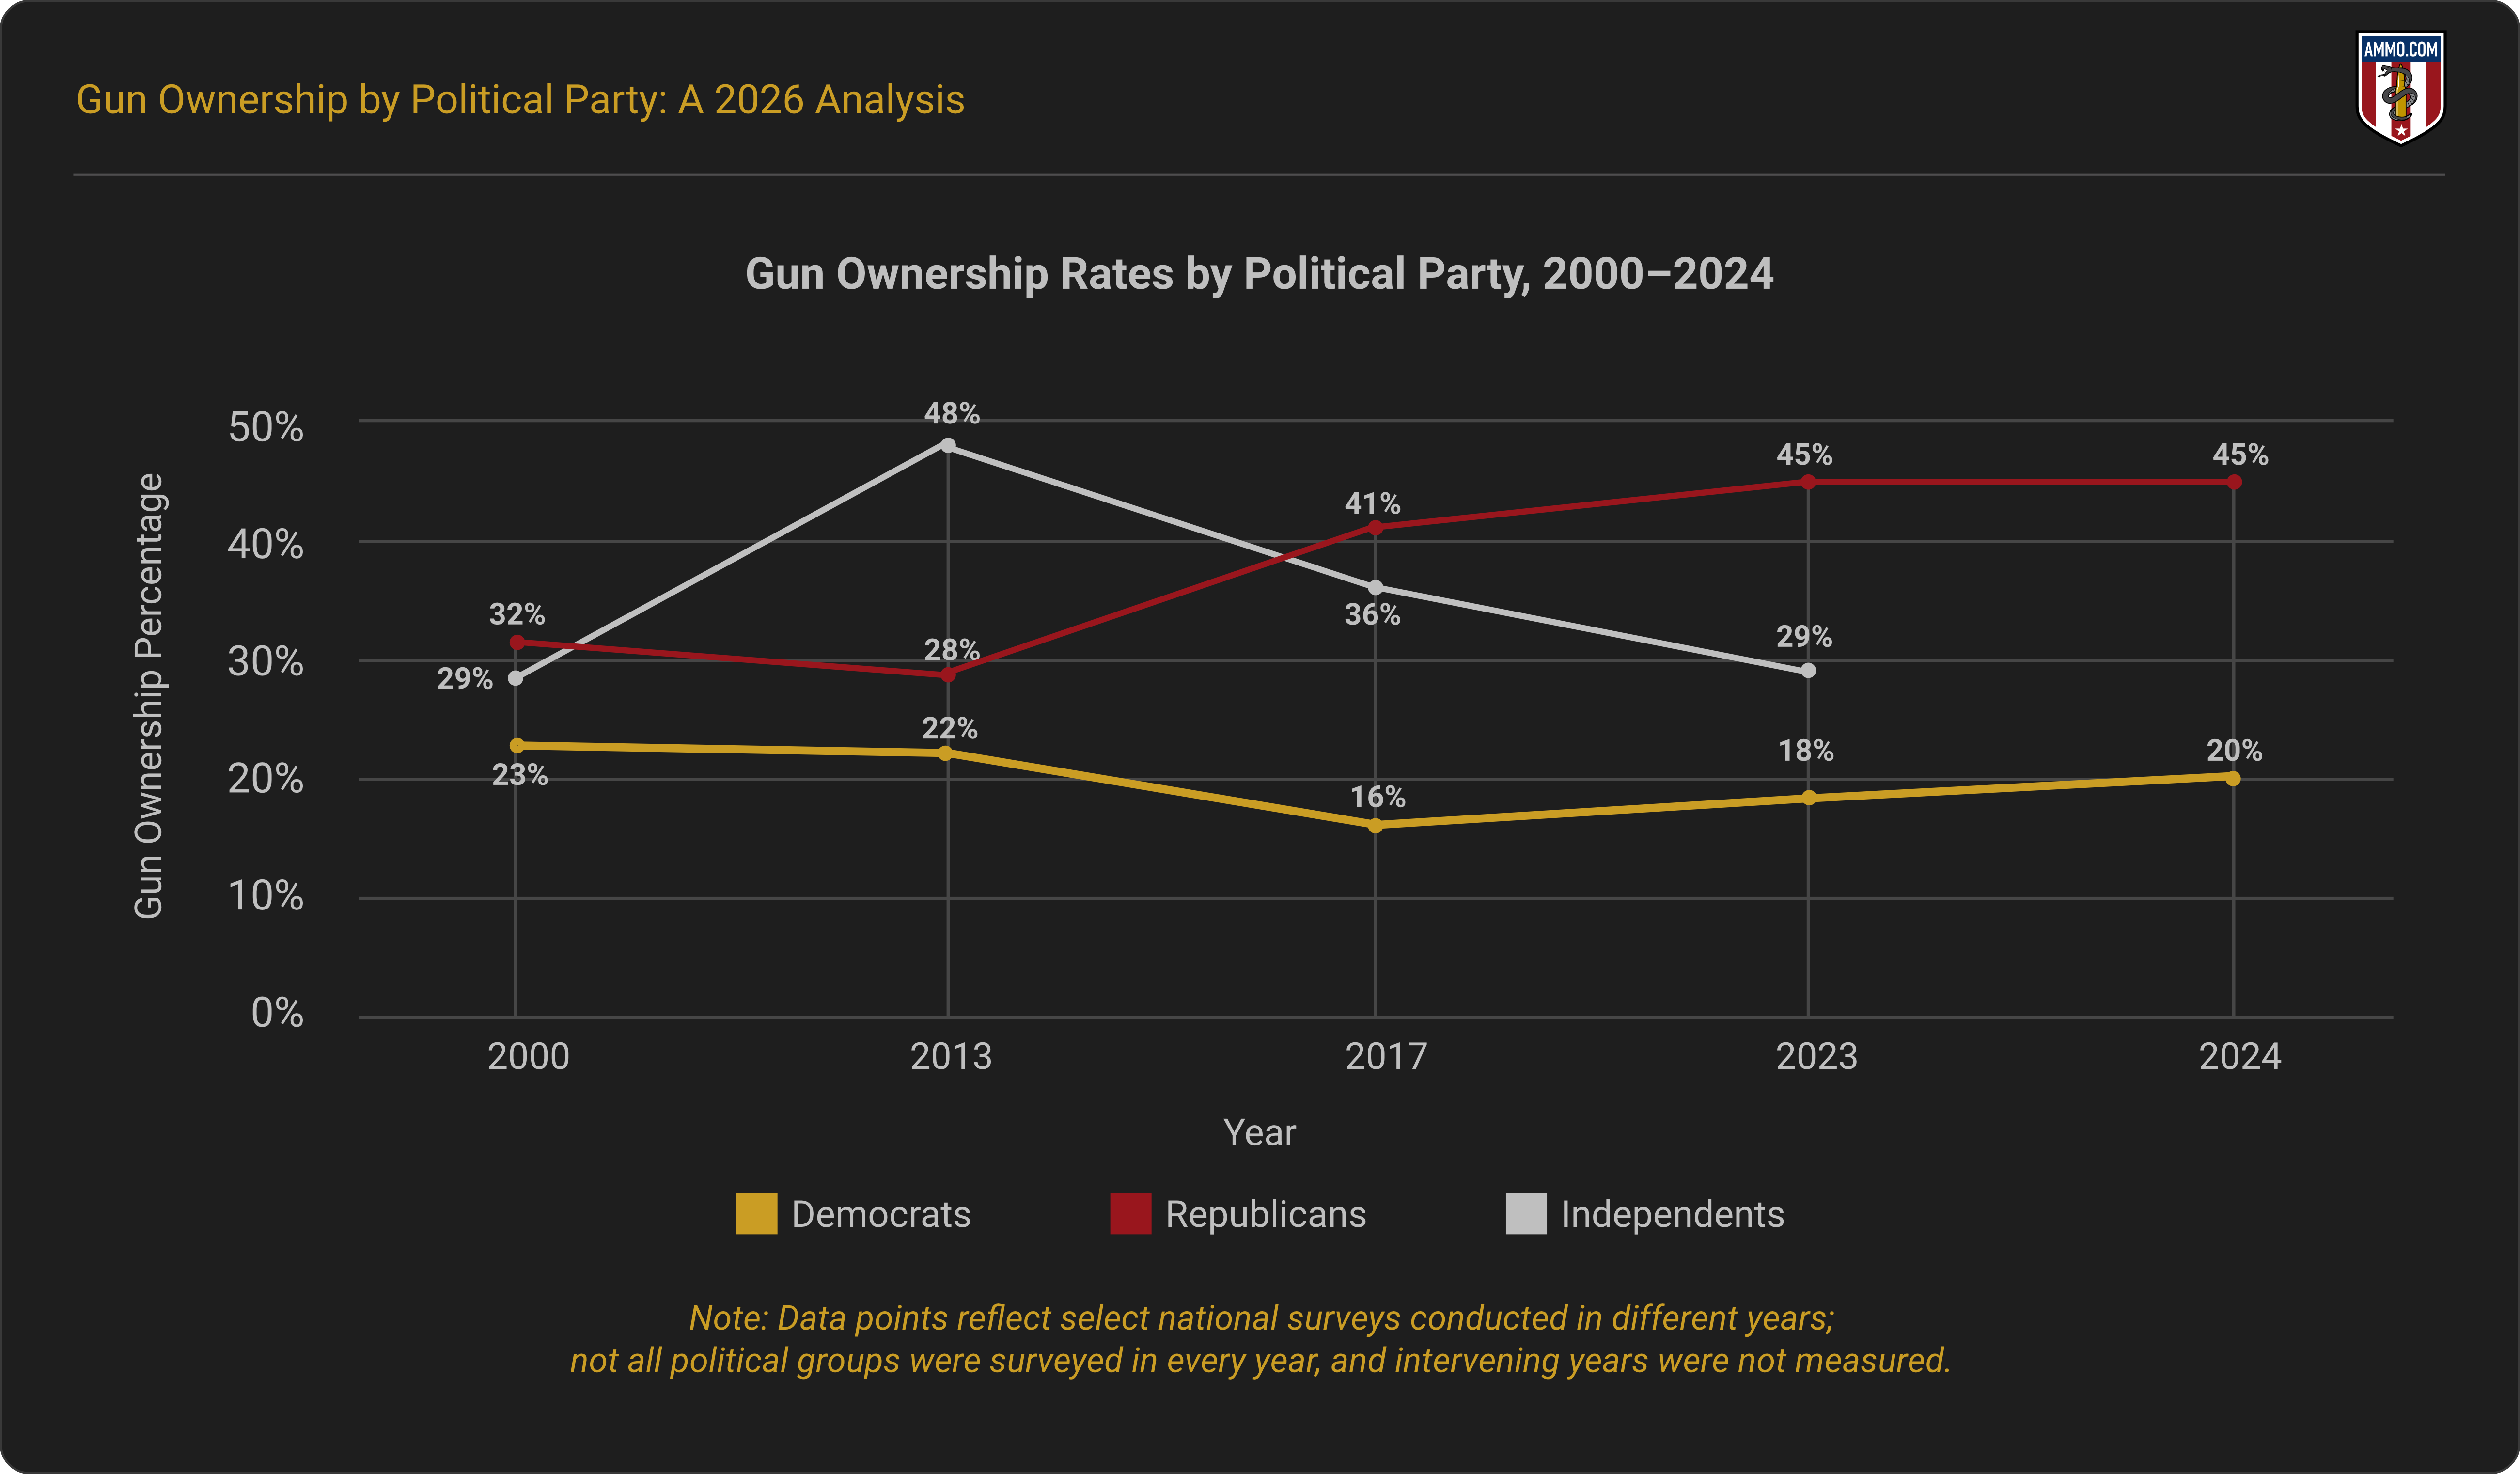
In 2000, 32% of Republicans reported owning firearms, compared to 23% of Democrats and 29% of independents. 1, 2, 5
The gap between gun ownership among political parties has broadened over the past 25 years. Democrat gun ownership has declined by three percentage points since 2000, while Republican ownership has increased by 13 percentage points.
Independents reported 29% ownership in 2000 and 29% ownership in 2023 (when they were last surveyed), with spikes in ownership reported in 2013 ( 48%) and 2017 (36%).
Gun Ownership by Political Party: Gender
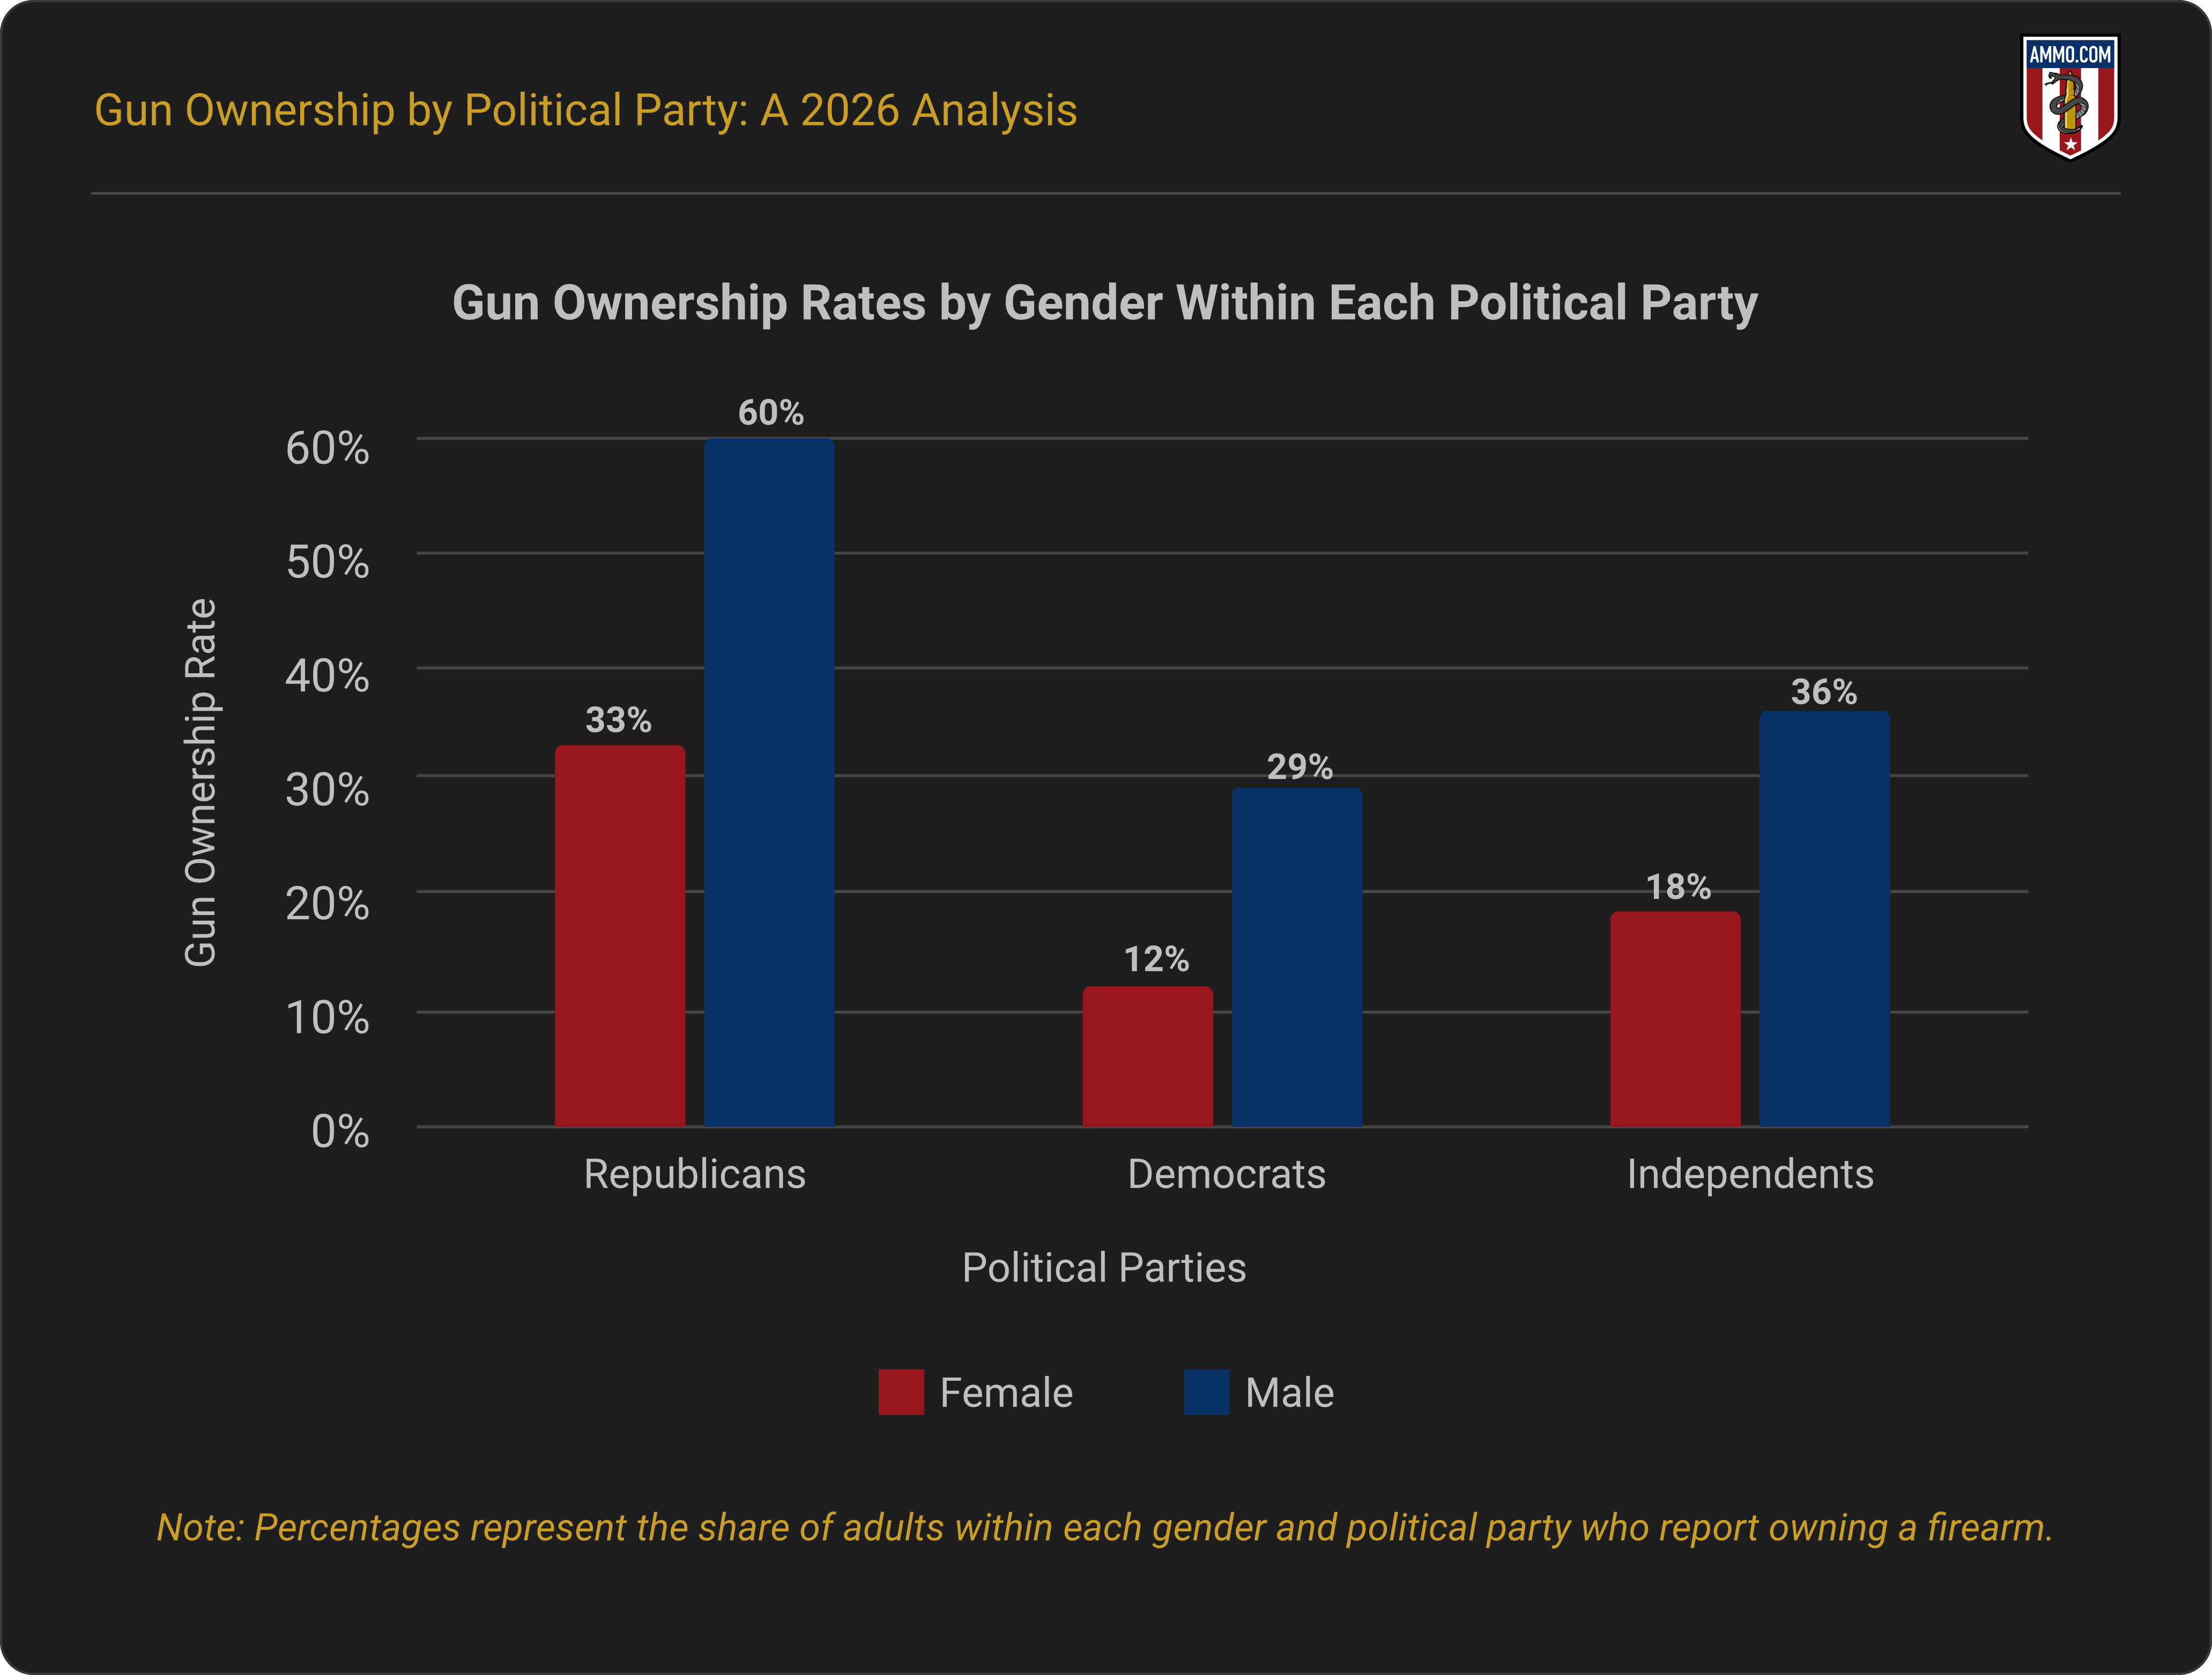
In 2024, Republican males were most likely to own firearms (60%) of all genders and voters. Independent male voters followed at 39% ownership. 2
Republican women (33%) were more likely to own guns than Democrat men (29%), Democrat women (12%), and independent women (18%).
Democrat Gun Ownership by Gender
In 2024, 29% of Democrat men stated they owned firearms, while only 12% of Democrat females stated the same.
Republican Gun Ownership by Gender
Republican men were more likely than Republican women to own guns in 2024: 60% and 33%, respectively.
Independent Gun Ownership by Gender
Independent men are more likely than independent women to own guns. In 2024, 18% of females stated they owned a firearm, compared to 36% of men.
Reasons for Gun Ownership by Political Party
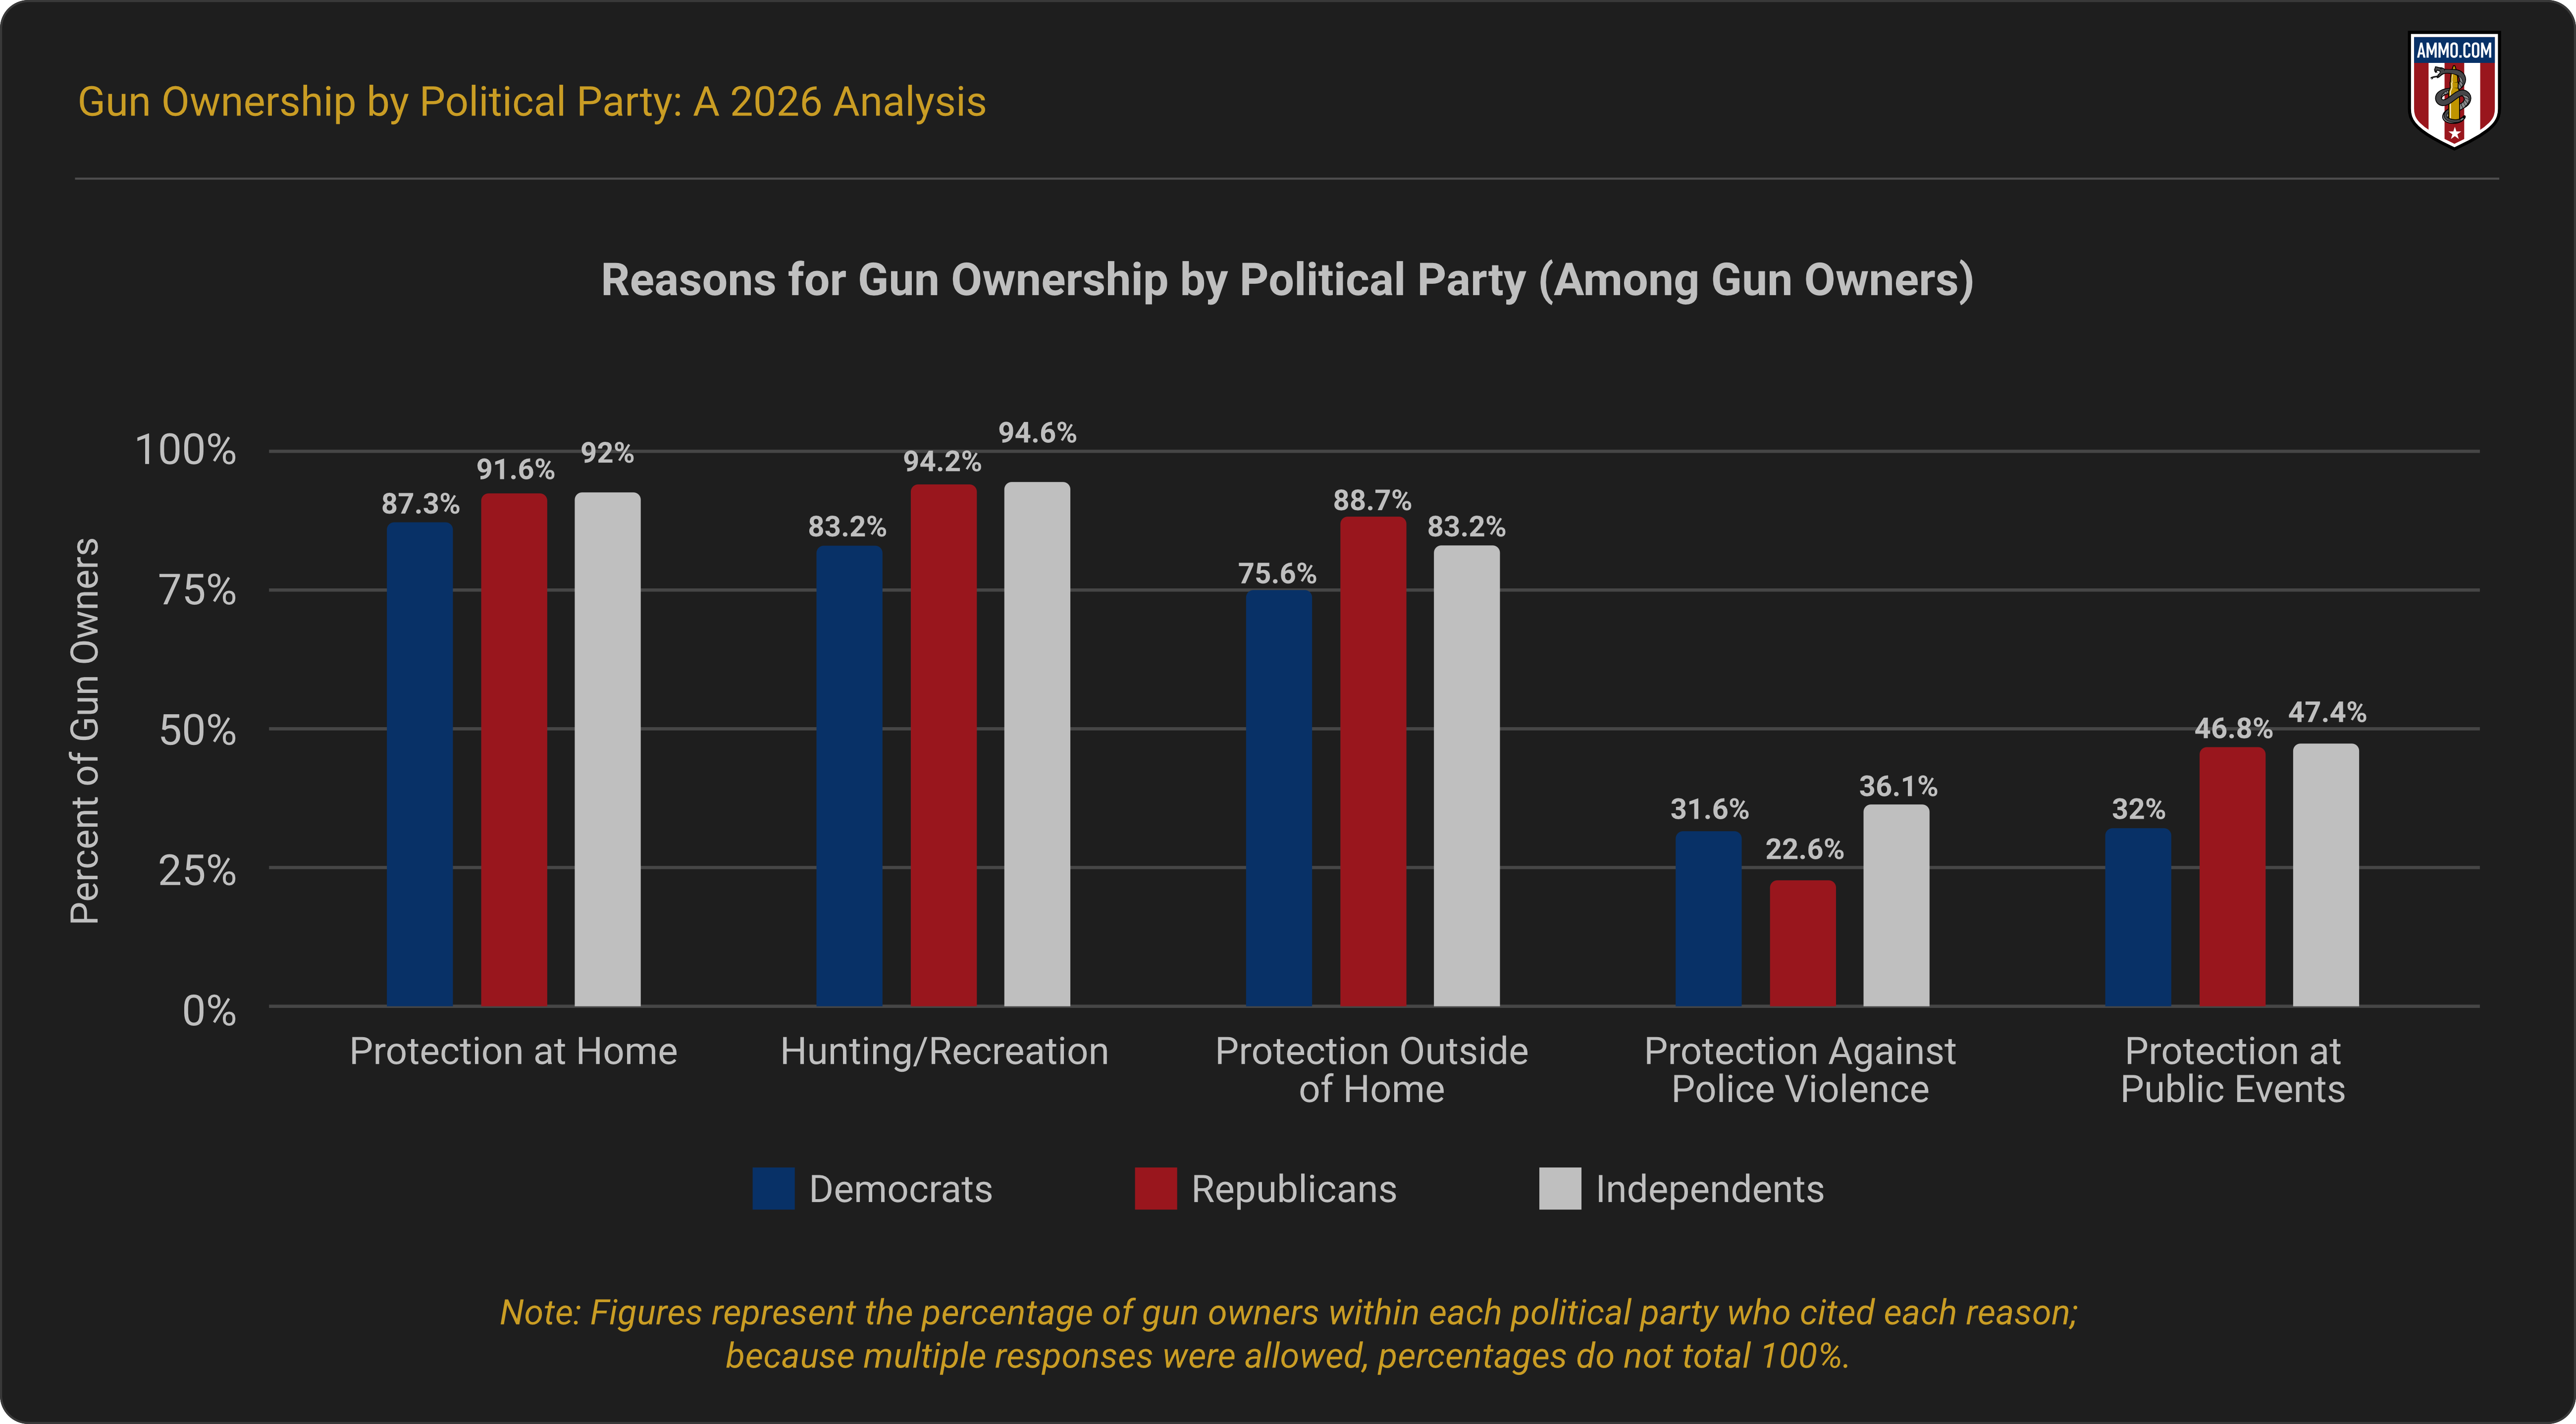
In 2024, most gun owners (91%), regardless of political party, cited "hunting or recreation" as a reason for owning a firearm. Many gun owners cited home protection (90%) and protection outside the home (83.3%). 3
Independent voters were most likely to say they own firearms for home protection (92.0%), for use against violence from the police (36.1%), hunting or recreation (94.6%), and protection at public events (47.4%).
Republican voters were most likely to cite protection outside of the home as a reason for defense (88.7%), and only slightly less likely to report owning firearms for all other categories listed.
Democrat voters were least likely to own firearms for all categories listed. Protection at home (87.3%), protection outside of the home (75.6%), and hunting or recreation (83.2%) were the most common reasons for gun ownership.
Do Gun Owners Actually Vote Based on Firearm Issues?
In 2024, 51% of registered voters surveyed stated that gun policy was one of many factors influencing their willingness to vote for a candidate. These percentages have declined from 65% in 1999. 7
In 1999, 14% of registered voters said they would only vote for candidates whose gun policies aligned with their own beliefs. In 2024, 29% of registered voters stated they would only vote for candidates if their gun policy beliefs aligned.
Only 17% of voters stated gun policy isn't a major issue, which is down from 19% in 1999.
Wrap-Up
Gun ownership in the U.S. has a strong partisan divide. Although Republicans and independents have maintained ownership rates higher than Democrats, the gap has widened in recent years.
Sources
- The Demographics of Gun Ownership: Pew Research (2017)
- Gun Ownership Rates Have Spiked Among Republican Women: Gallup (2024)
- Reasons for Gun Ownership Among Demographically Diverse New and Prior Gun Owners
- Key Facts About Americans and Guns: Pew Research (2024)
- Gun Ownership Trends and Demographics: Pew Research (2013)
- Men, Married, Southerners Most Likely to Be Gun Owners
- Guns: Gallup (1990)

Infographics
- Are Guns & Ammo The New Gold? Why More Americans Are Arming Themselves
- The Greatest Gun Salesman In America: President Barack Obama
- Shooting Straight: How Both Presidential Candidates Have Changed On Gun Control
- President Obama: (Still) The Greatest Gun Salesman in America
- An Inconvenient Truth: How The Obama Administration Became Earth's Largest Arms Dealer
- Armed Drones: President Obama's Weapon of Choice
- COVID-19 Data Study: Ammunition Sales Continue to Soar in Response to Coronavirus Panic
- Data Study: 18 Months of Ammo Sales during a Pandemic, Protests, and the Biden Presidency
- Data Study: U.S. Ammo Sales Surge Following Russian Invasion of Ukraine
- Most Gun-Friendly States
- Worst States to be a Gun Owner
- Children & Firearms: Definitions and Demographics Make All the Difference
- Urban Violent Crime & Legal Gun Ownership
- Gun-Free School Zone Laws & School Shootings
- Gun Control Laws and Enforcement Trends
- Gun Ownership by State
- How Many Gun Owners are in America?
- Concealed Carry Crime Stats
- Accidental Shooting Statistics: A Review of Unintentional Firearm Deaths
- America's Stolen Guns: A Silent Contributor to Gun Crimes in the U.S.
- Gun Violence Statistics: Comprehensive Look at the Data
- Gun Laws vs. Crime Rates: A Comprehensive Analysis
- Gun Death Statistics by Caliber: A Review of Calibers and Crime
- Anti-Gun Control Arguments: Facts Gun Control Lobby Suppress
- Guns in the Home Statistics: The Effects of Firearms in the Home
- Gun Deaths in the US: Analyzing At-Risk Demographics
- How Many Guns in the U.S.: All About America's Firearms
- Gun Facts in the U.S.: The Reality of Firearms in America
- Defensive Gun Use Statistics: America's Life-Saving Gun Incidents
- Correlation Between Mass Shootings and Prescription Drugs
- Gun Ownership by Gender: Closing the Gender Gap
- Murders by Weapon Type: Statistics
- Gun Violence Among Black Americans: Statistics
- The Ultimate Hunting Caliber Chart: Best Cartridge Per Species
- How Old Do You Have to be to Buy a Gun: A State Guide
- Most Popular Guns in the U.S.: The Must-Have Guns
- Stray Bullet Deaths: Accident and Injury Statistics
- Mass Shooters by Race: Demographics of Assailants
- Ammunition Limits By State: How Much Ammo Can You Buy?
- Why Do Americans Own Guns?
- How Many Americans Want Stricter Gun Laws?
- How Many Households in the U.S. Have a Gun?
- What Percentage of Gun Deaths are Suicides?
- Average Age of Mass Shooters in the U.S.
- Firearm Ownership in America by Year
- US Firearms Deaths Per Year: A Collective Report
- Percentage of Americans Owning Guns
- Texas Gun Ownership: Total Numbers, Trends, and Most Popular Guns
- Gun Ownership Statistics Colorado: Trends & Numbers
- Hunting Accident Statistics (Causes & Trends Per Year)
- Banned Guns & Ammo List: A Review by State
- 3D Printed Gun Laws By State
- How To Build a Home Shooting Range: The Ultimate Guide
- States With the Highest Murder Rates
- Best Self-Defense Weapons for Women
- Easiest States to Buy a Gun
- Cities with the Lowest Crime Rate
- Oregon Homicide Rates
- Chicago Homicide Rate
- How Much Does a Suppressor Reduce Noise
- Texas Homicides: Statistics and Trends
- California Homicides: Rates Per 100K
- Florida Murder Rate: Statistics and Trends
- Gun Ownership by Political Party
- Mass Shooters by Gender
- U.S. Hunting and Fishing Statistics
- Where Are Silencers Illegal? State Suppressor Laws
- How Loud is a Gunshot?