Texas Homicides: 2025 Statistics and Trends
Report Highlights:
-
Texas’ homicide rate declined from 7.10 per 100,000 people in 2023 to 5.88 per 100,000 in 2024.
-
Texas ranked 24th nationally for homicides in 2024, with lower rates than Georgia and Illinois, but higher rates than California, Florida, and New York.
-
Males in Texas were nearly 3.5 times more likely to be homicide victims than women in 2024, with rates of 9.25 versus 2.52 per 100,000.
-
Young adults (20-24) had the highest homicide rate in 2024, while children and adults over 45 had the lowest rates.
Related Studies: States With the Highest Murder Rates | Gun Ownership by State | Texas Gun Ownership: Total Numbers, Trends, and Most Popular Guns
Murders in Texas by Year
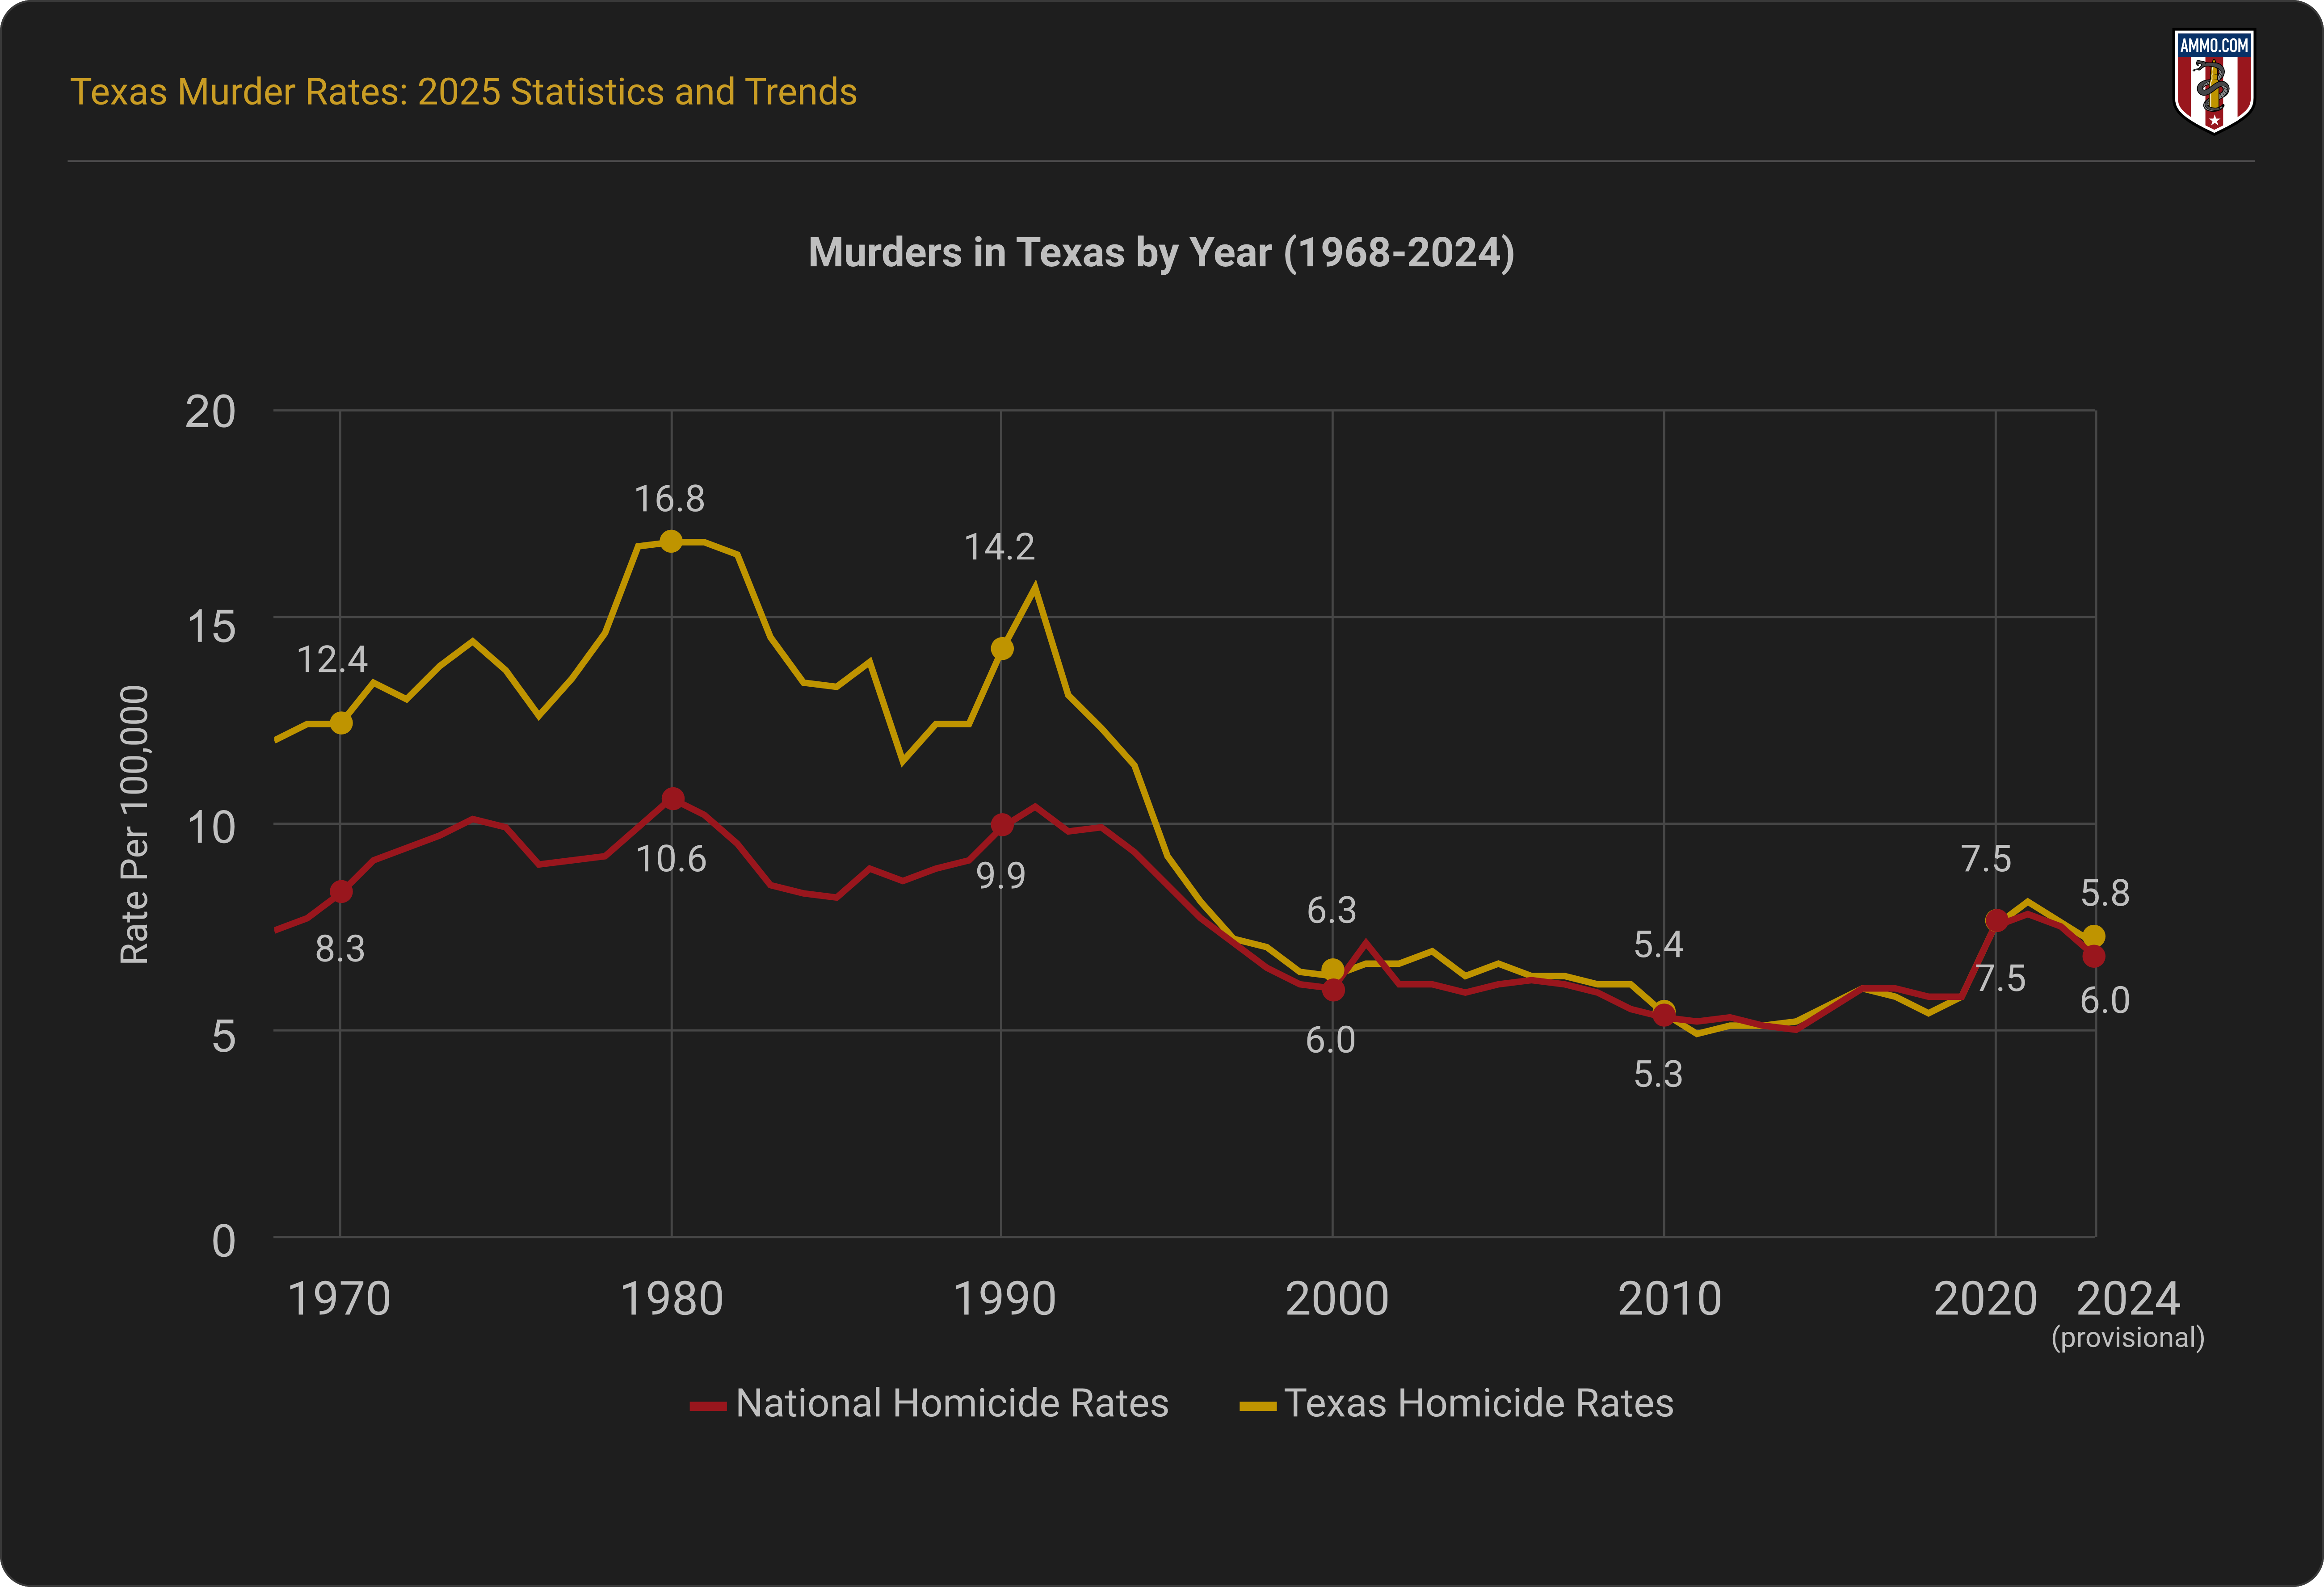
In 2024, Texas’ homicide rate was 5.88 per 100,000 people; down from 7.10 per 100,000 in 2023. The state’s homicide rate averaged 9.76 per 100,000 between 1968 and 2024. 1, 2
In 1968, Texas’ homicide rate was 12.00 per 100,000. That rate peaked in 1980 and 1981 at 14.70 per 100,000. The state’s rate remained high until 2001, when it decreased below the national average of 7.1 to 6.6 per 100,000.
The rate remained between 6 and 7 per 100,000 until it declined to its lowest in 2011 (4.90 per 100,000). It increased to 5.00 per 100,000 during the 2010s, and increased with the rest of the nation during COVID (7 to 8 per 100,000).
Texas Murders Compared to Other States
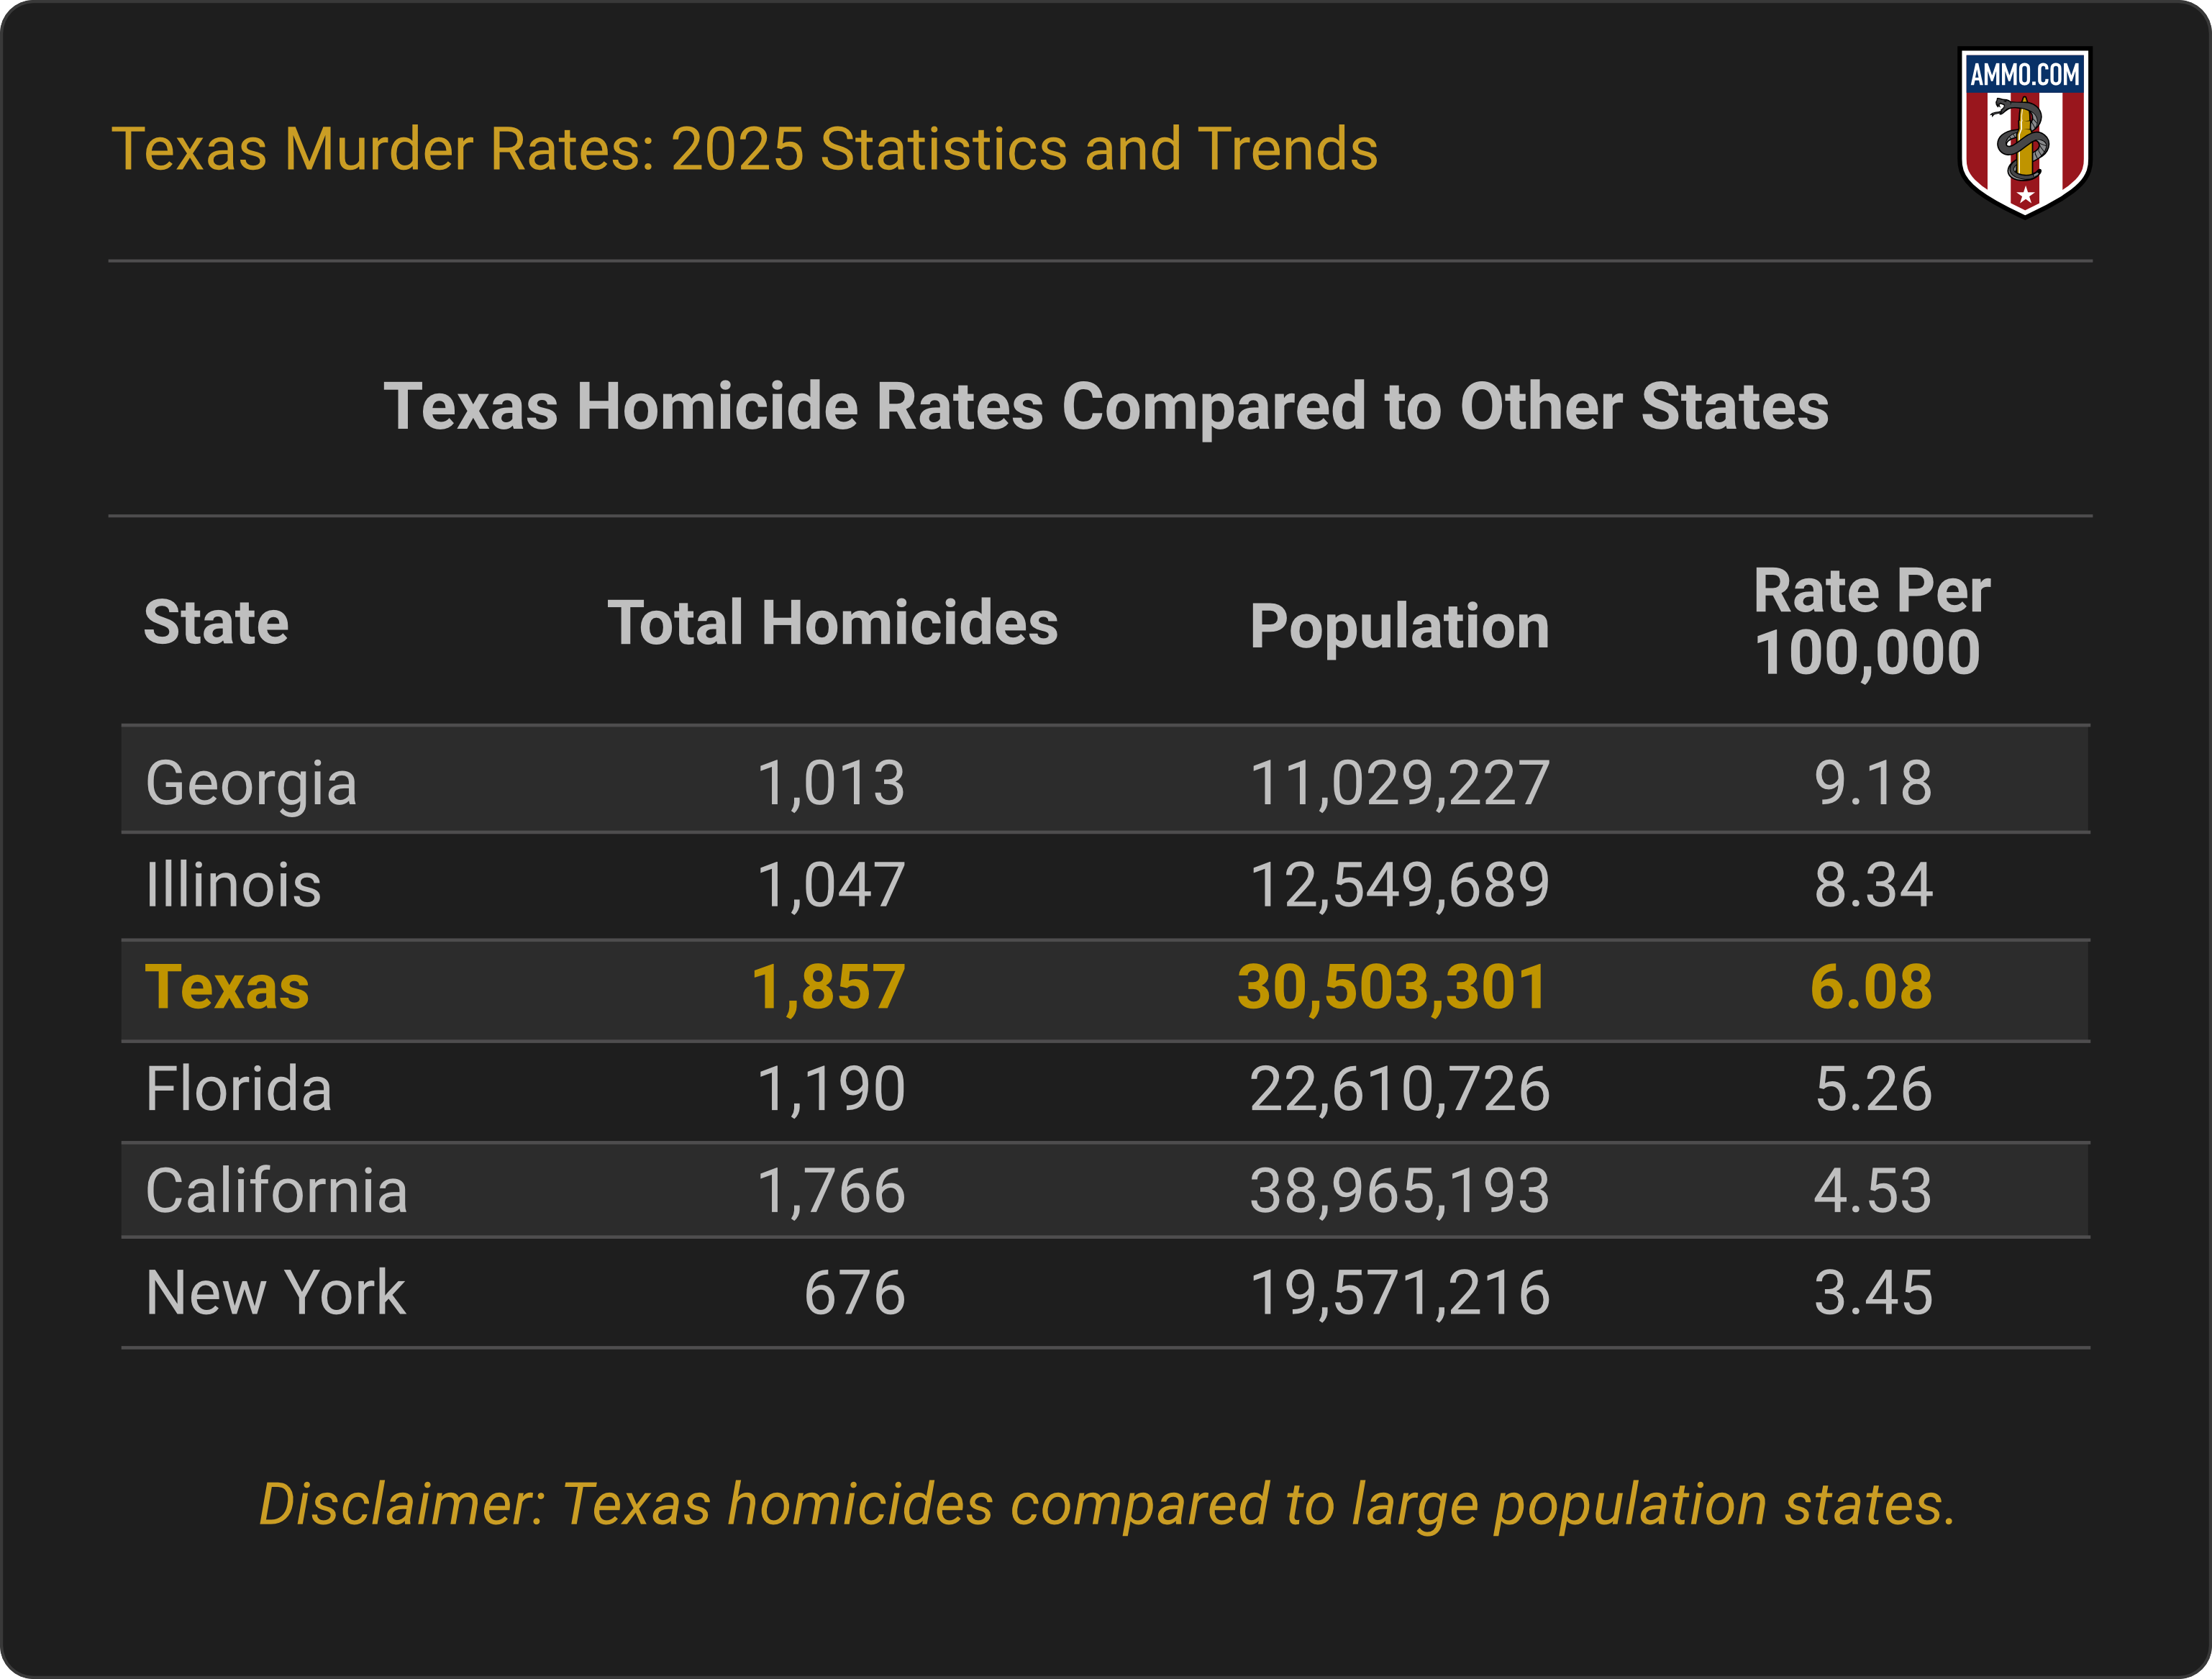
Texas ranked 24th for homicides in the United States in 2024. The state had the second largest population in the nation and 1,857 homicides in the same year. 1, 2
Compared to five other populous states with similar and opposing firearm and sanctuary policies, Texas ranked third for homicides.
California (4.53 per 100,000), Florida (5.26 per 100,000), and New York (3.45 per 100,000) had lower homicide rates than Texas in 2024. Georgia and Illinois had higher homicide rates at 9.18 and 8.34 per 100,000, respectively.
How Does Texas Compare to the National Average?
Texas’ homicide rate in 2024 was 5.88 per 100,000; slightly below the national average of 6.00 per 100,000. 1, 2, 3
Between 1968 and 1996, Texas’ homicide rate averaged 13.80 per 100,000; higher than the 9.02 per 100,000 national average. In the late 1990s, Texas’ rates declined until it aligned more with the national average, sporadically decreasing and increasing but remaining below 8 per 100,000.
In 2021, the nation and Texas’ homicide rates increased to their highest in two decades (8.10 per 100,000 and 7.80 per 100,000, respectively). National and state rates declined in 2022 and continued to decrease through 2024.
Counties With the Highest Homicide Rates in Texas
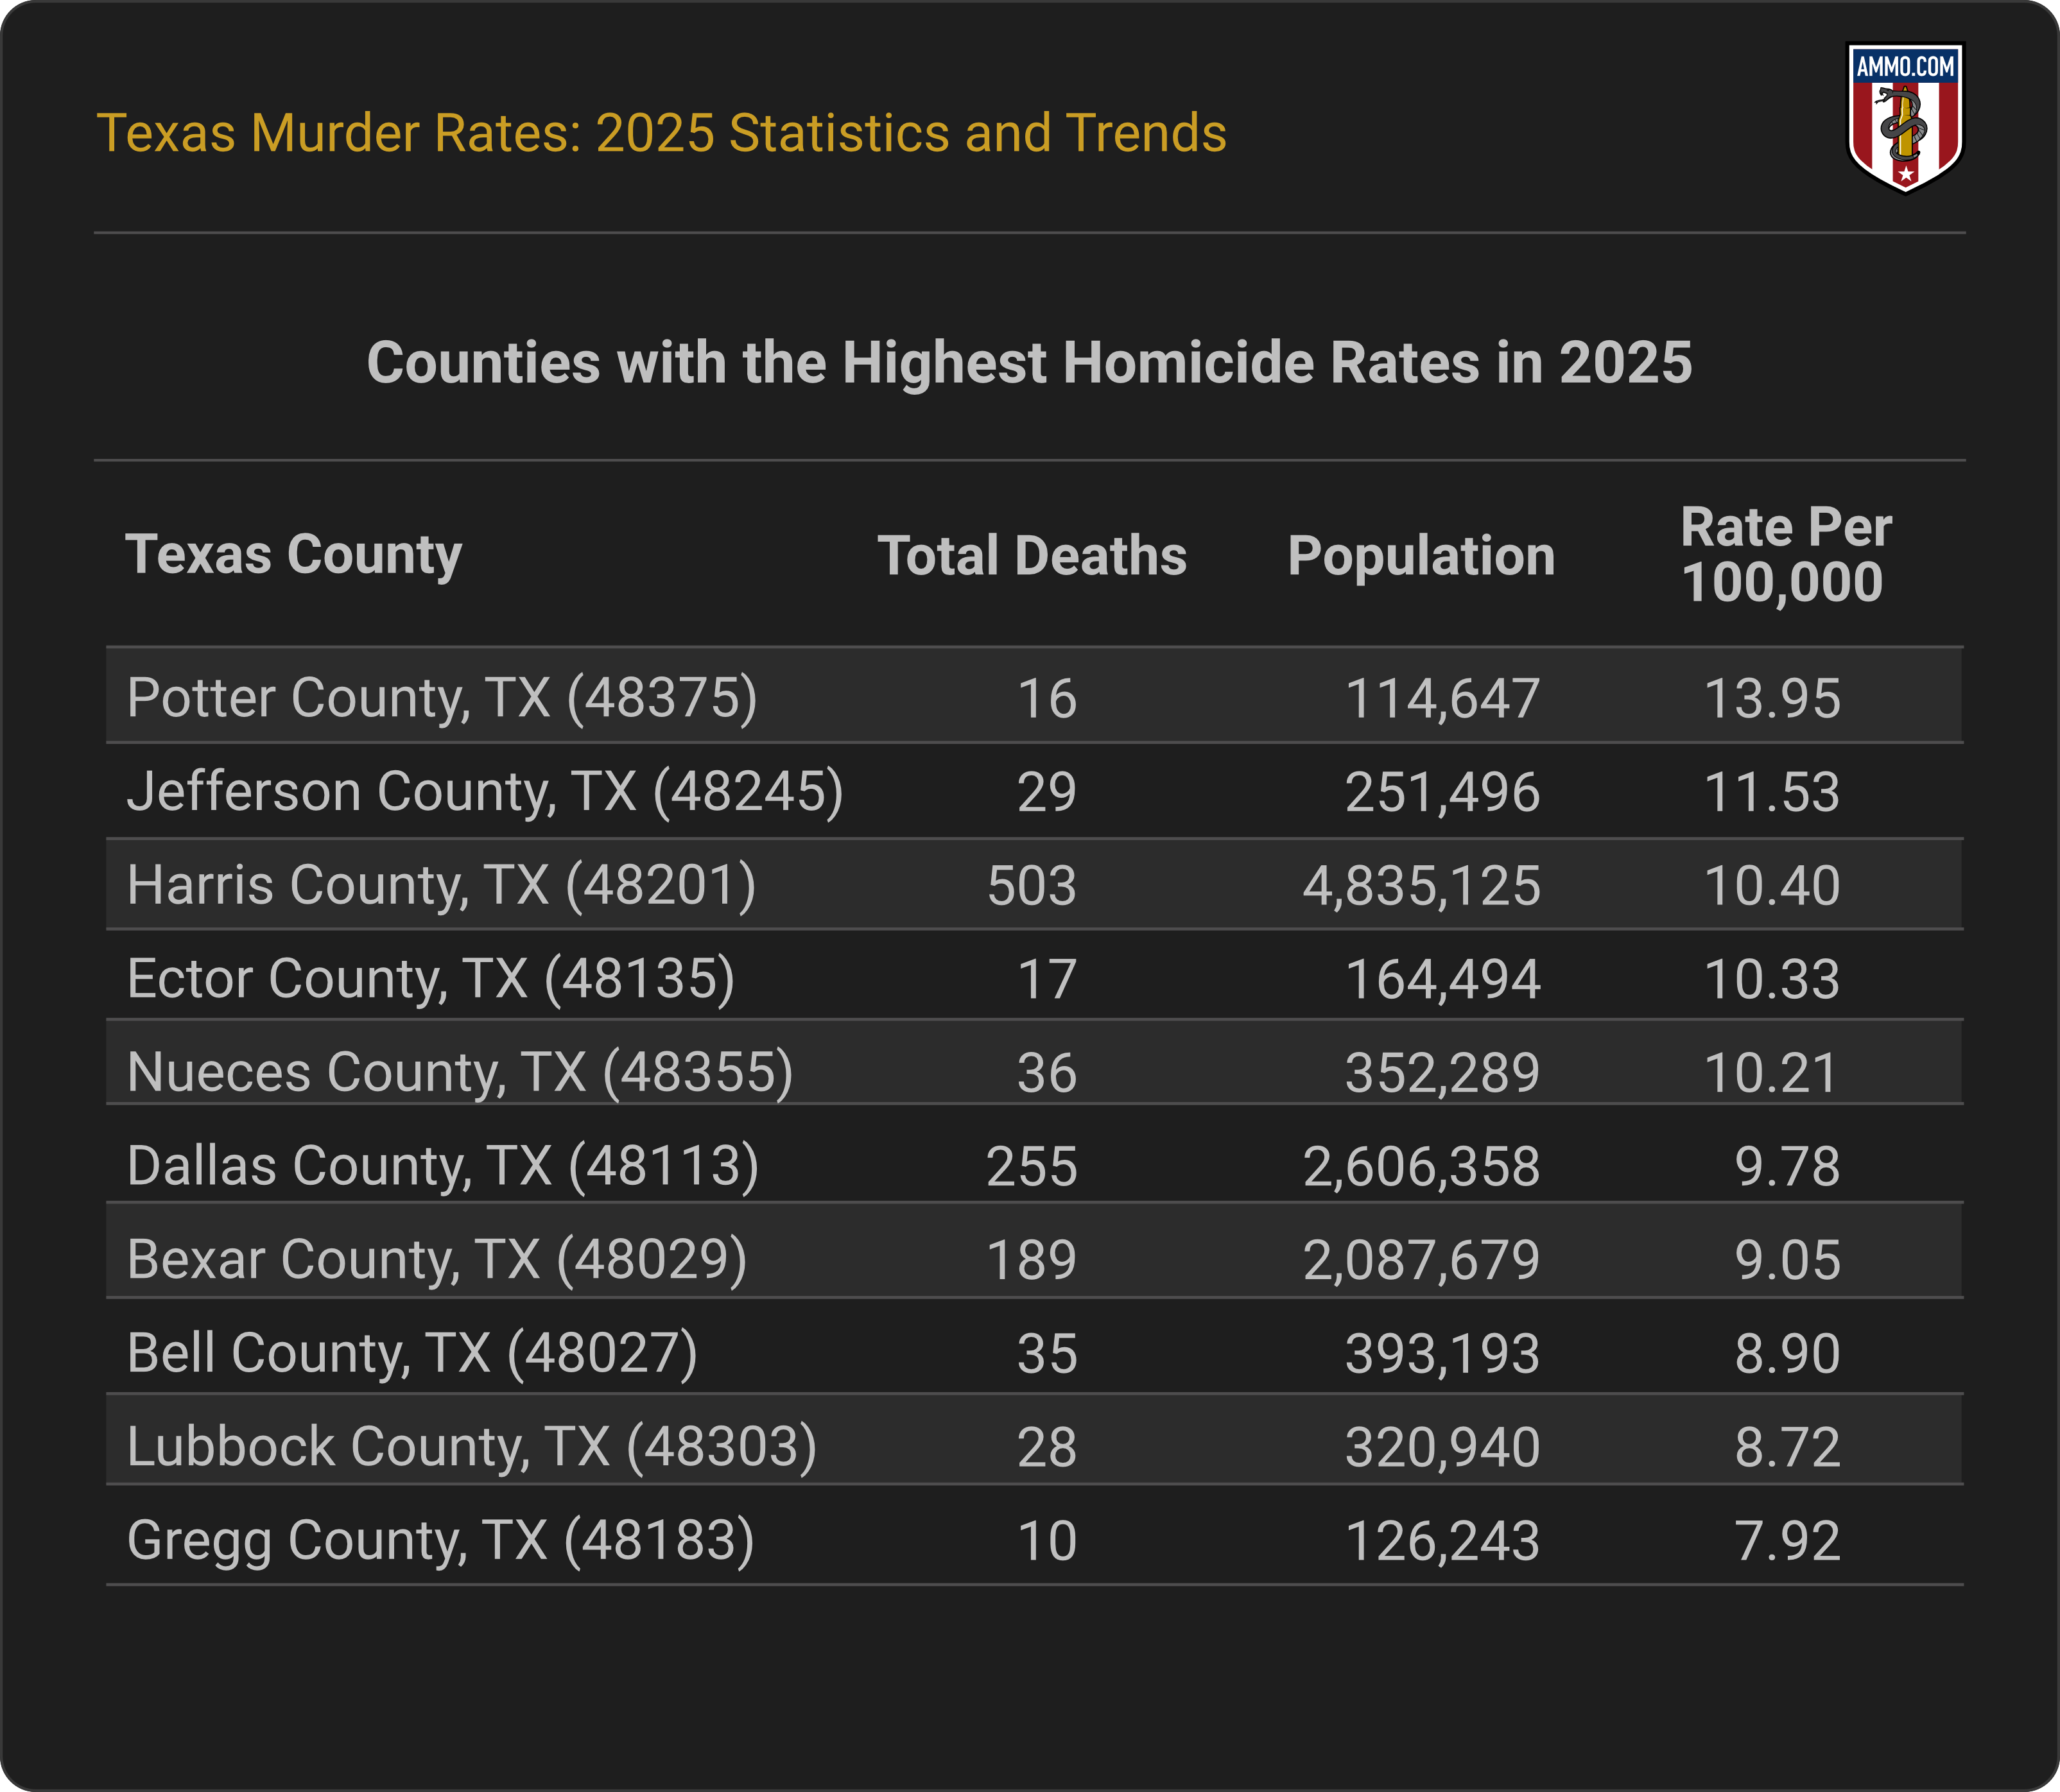
In 2024, Dallas County had the most homicides (255) of any county in Texas, and a homicide rate of 9.78 per 100,000. 1, 2, 3
The top five Texan counties with the highest homicide rates in 2024 were Potter, Jefferson, Harris, Ector, and Nueces County.
Potter County had the highest homicide rate in 2024 at 13.96 per 100,000 (16 murders), followed by Jefferson County at 11.50 per 100,000 (29 murders). Harris County had a rate of 10.40 per 100,000 (503 murders); Ector County, 10.3 per 100,000 (17 murders); Nueces County, 10.22 per 100,000 (36 murders).
Texas Murder Rate by City
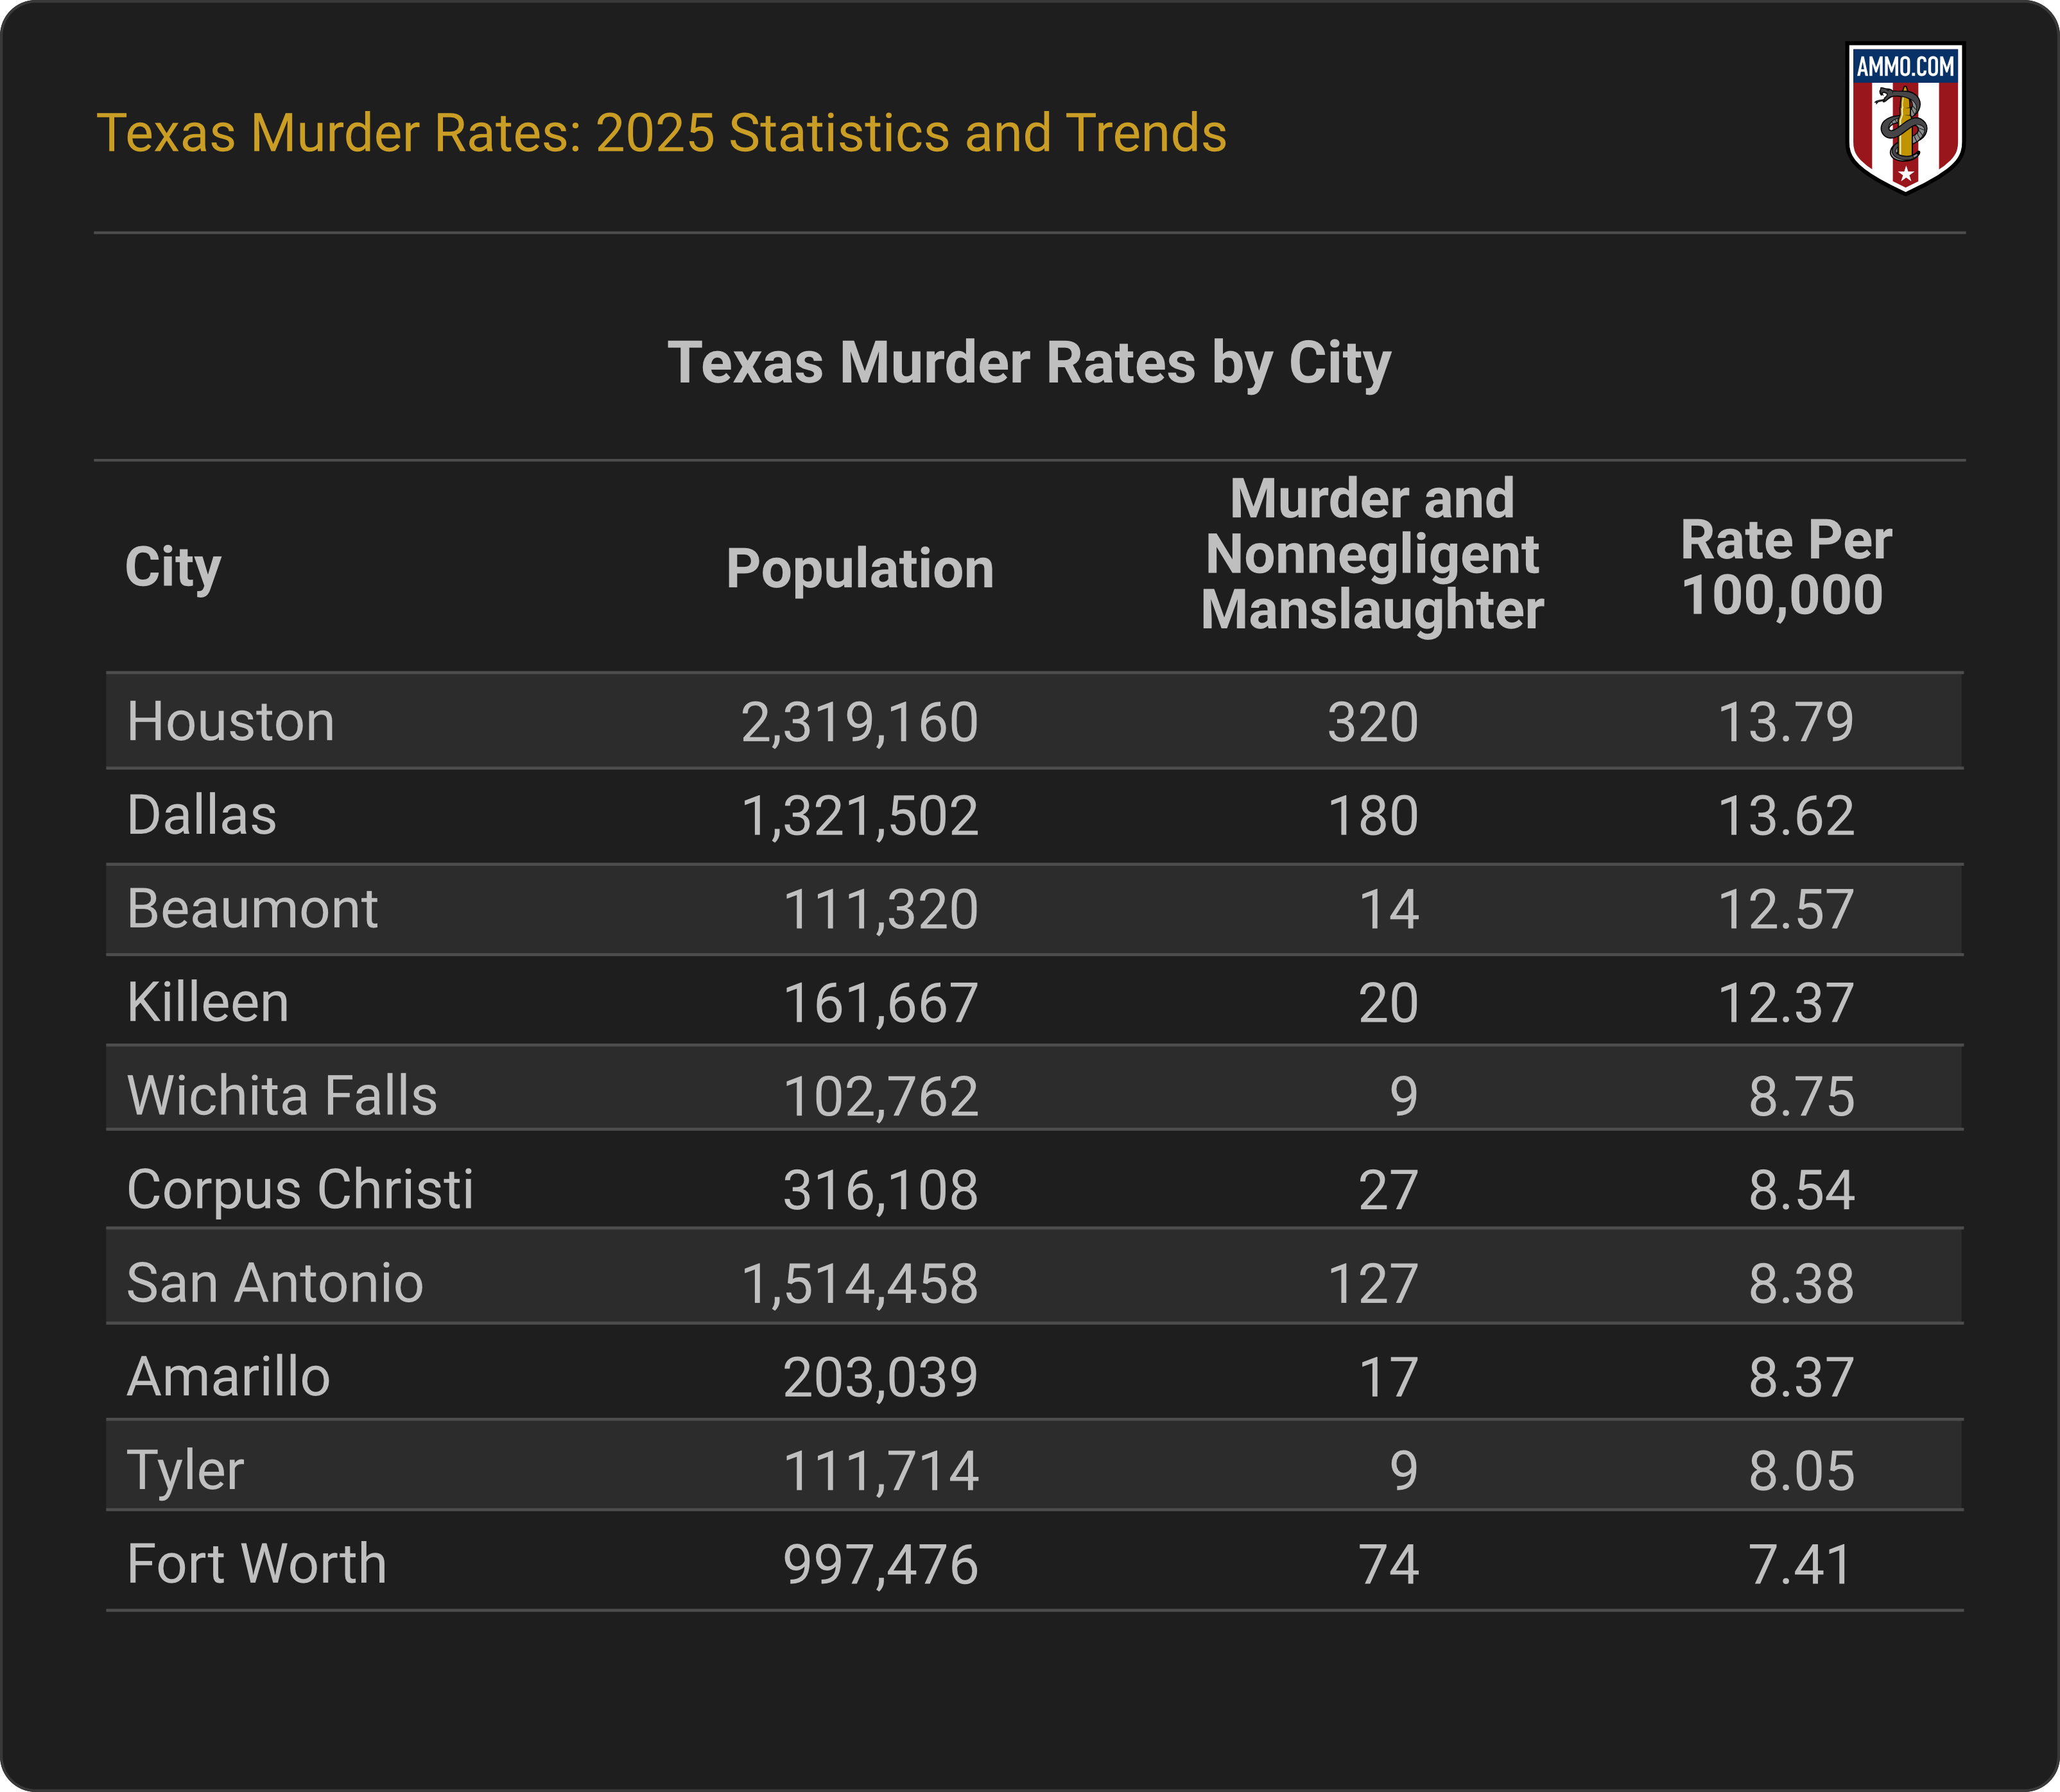
Houston had the highest homicide rate of any city in Texas in 2024 at 13.80 per 100,000 (320 murders), followed by Dallas, Beaumont, Killeen, and Wichita Falls. 3
According to the FBI Crime Data Explorer, Dallas reported 180 homicides in 2024 (13.62 per 100,000), Beaumont reported 14 (12.58 per 100,000), Killeen reported 20 (12.37 per 100,000), and Wichita Falls reported nine (8.76 per 100,000).
Note: Cities with fewer than 100,000 people were excluded from this study, because smaller cities have unrealistically high rates.
Texas Homicide Victims by Gender
In 2024, the homicide rate for men in Texas was nearly three and a half times higher than for women. 1, 2
Men died at a rate of 9.25 per 100,000 (1,407 murders). Women died at a rate of 2.52 per 100,000 (386 murders).
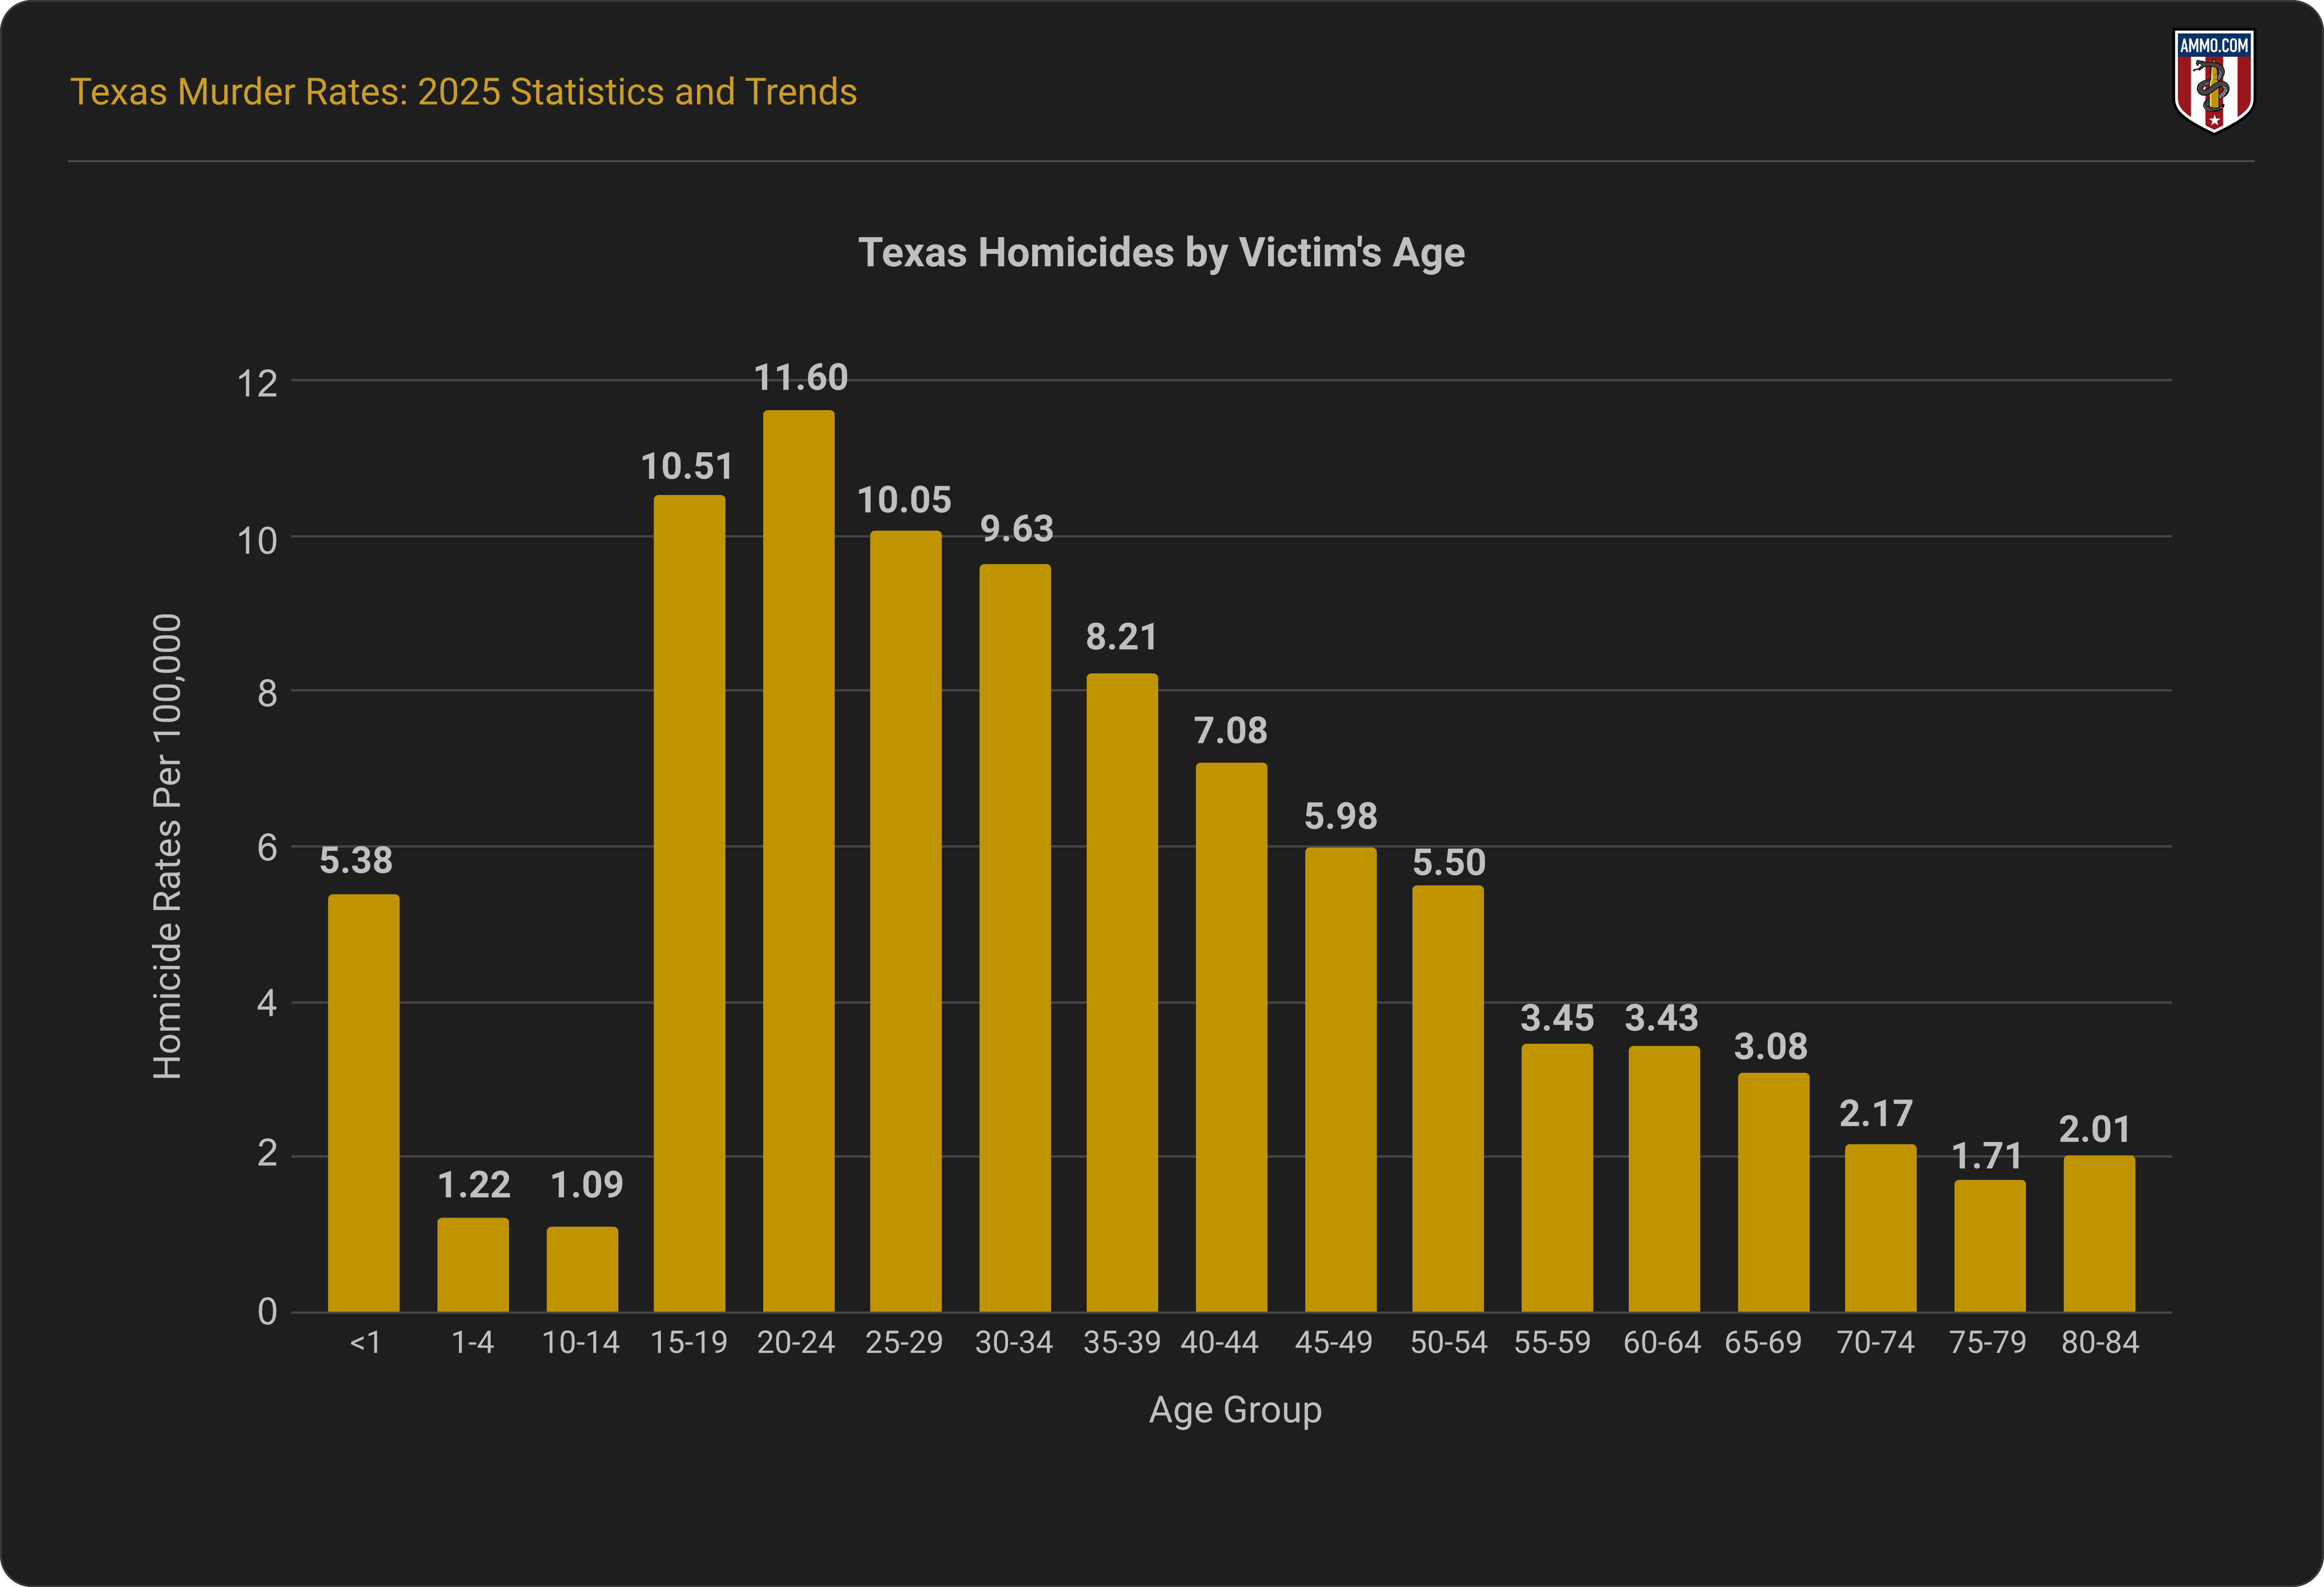
Texas Homicide Victims by Age
Individuals between 20 and 24 died by homicide at a higher rate than any other age group in Texas in 2024 (11.61 per 100,000). Preteens and younger teenagers between the ages of 10 and 14 died at the lowest rates (1.09 per 100,000) that year. 1, 2
Texans between the ages of 15 and 19 died at a rate of 10.52 per 100,000, while those between 25 and 29 died at a rate of 10.05 per 100,000. Those between 30 and 44 also died at rates higher than 7 per 100,000.
Texans between birth and 4 years old, as well as older citizens (45+), died at lower rates than those in their late teens and early thirties.
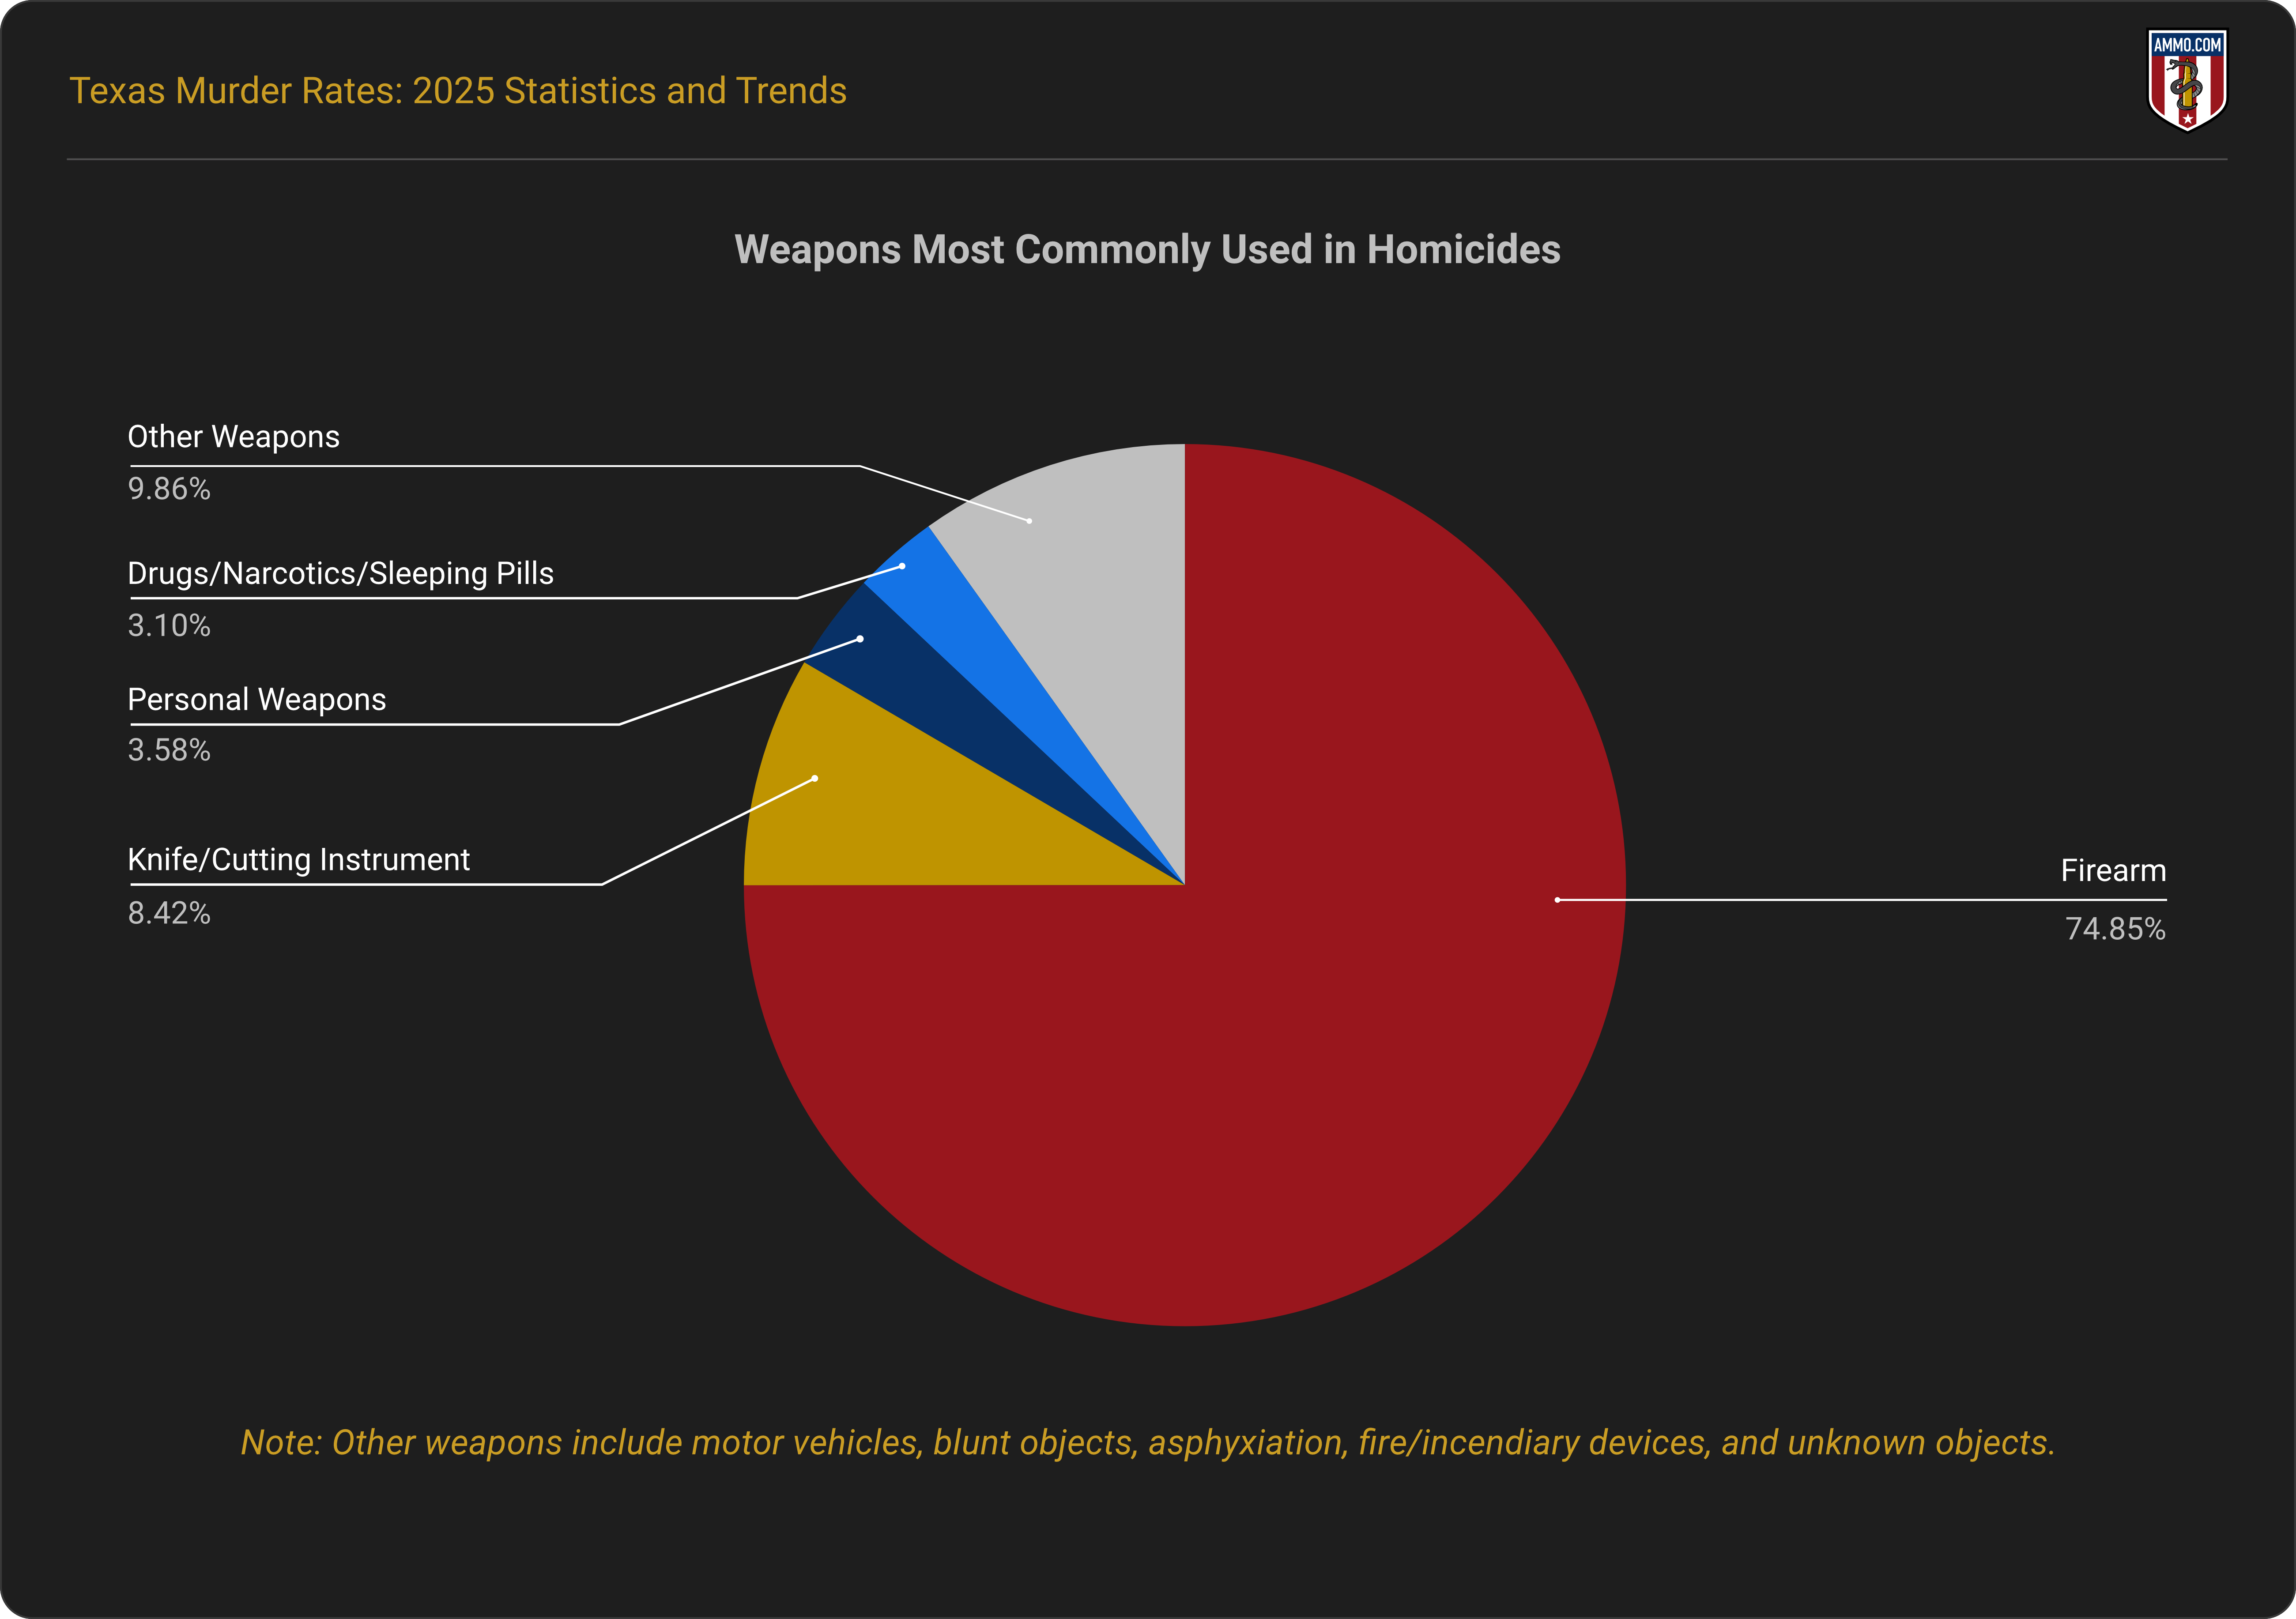
Weapons Most Commonly Used In Homicides
Of the 1,674 homicides reported to the FBI in 2024, 74.85% involved firearms, 8.42% involved knives or cutting instruments, 3.58% involved personal weapons (hands, feet, fists, etc.), 3.10% involved drugs, narcotics, or sleeping pills, and 9.86% involved other weapons.
Firearm data reported to the FBI varies by agency, with some jurisdictions identifying specific firearm types and others reporting incidents under a general firearm category. To ensure consistency across reporting agencies, all incidents classified as involving a firearm, regardless of subtype, are grouped into a single firearms category.3, 4
Wrap-Up
Texas’ homicide rate has declined in recent years and now sits just below the national average, reflecting broader post-pandemic trends. While the state continues to see concentrated violence in certain areas, overall homicide levels remain significantly lower than historic highs.
Sources
- CDC WONDER Database: Underlying Cause of Death
- CDC WONDER Database: Provisional Mortality Statistics
- FBI Crime Data Explorer
- Commonly Used Weapons for Homicides in Texas

Infographics
- Are Guns & Ammo The New Gold? Why More Americans Are Arming Themselves
- The Greatest Gun Salesman In America: President Barack Obama
- Shooting Straight: How Both Presidential Candidates Have Changed On Gun Control
- President Obama: (Still) The Greatest Gun Salesman in America
- An Inconvenient Truth: How The Obama Administration Became Earth's Largest Arms Dealer
- Armed Drones: President Obama's Weapon of Choice
- COVID-19 Data Study: Ammunition Sales Continue to Soar in Response to Coronavirus Panic
- Data Study: 18 Months of Ammo Sales during a Pandemic, Protests, and the Biden Presidency
- Data Study: U.S. Ammo Sales Surge Following Russian Invasion of Ukraine
- Most Gun-Friendly States
- Worst States to be a Gun Owner
- Children & Firearms: Definitions and Demographics Make All the Difference
- Urban Violent Crime & Legal Gun Ownership
- Gun-Free School Zone Laws & School Shootings
- Gun Control Laws and Enforcement Trends
- Gun Ownership by State
- How Many Gun Owners are in America?
- Concealed Carry Crime Stats
- Accidental Shooting Statistics: A Review of Unintentional Firearm Deaths
- America's Stolen Guns: A Silent Contributor to Gun Crimes in the U.S.
- Gun Violence Statistics: Comprehensive Look at the Data
- Gun Laws vs. Crime Rates: A Comprehensive Analysis
- Gun Death Statistics by Caliber: A Review of Calibers and Crime
- Anti-Gun Control Arguments: Facts Gun Control Lobby Suppress
- Guns in the Home Statistics: The Effects of Firearms in the Home
- Gun Deaths in the US: Analyzing At-Risk Demographics
- How Many Guns in the U.S.: All About America's Firearms
- Gun Facts in the U.S.: The Reality of Firearms in America
- Defensive Gun Use Statistics: America's Life-Saving Gun Incidents
- Correlation Between Mass Shootings and Prescription Drugs
- Gun Ownership by Gender: Closing the Gender Gap
- Murders by Weapon Type: Statistics
- Gun Violence Among Black Americans: Statistics
- The Ultimate Hunting Caliber Chart: Best Cartridge Per Species
- How Old Do You Have to be to Buy a Gun: A State Guide
- Most Popular Guns in the U.S.: The Must-Have Guns
- Stray Bullet Deaths: Accident and Injury Statistics
- Mass Shooters by Race: Demographics of Assailants
- Ammunition Limits By State: How Much Ammo Can You Buy?
- Why Do Americans Own Guns?
- How Many Americans Want Stricter Gun Laws?
- How Many Households in the U.S. Have a Gun?
- What Percentage of Gun Deaths are Suicides?
- Average Age of Mass Shooters in the U.S.
- Firearm Ownership in America by Year
- US Firearms Deaths Per Year: A Collective Report
- Percentage of Americans Owning Guns
- Texas Gun Ownership: Total Numbers, Trends, and Most Popular Guns
- Gun Ownership Statistics Colorado: Trends & Numbers
- Hunting Accident Statistics (Causes & Trends Per Year)
- Banned Guns & Ammo List: A Review by State
- 3D Printed Gun Laws By State
- How To Build a Home Shooting Range: The Ultimate Guide
- States With the Highest Murder Rates
- Best Self-Defense Weapons for Women
- Easiest States to Buy a Gun
- Cities with the Lowest Crime Rate
- Oregon Homicide Rates
- Chicago Homicide Rate
- How Much Does a Suppressor Reduce Noise
- Texas Homicides: Statistics and Trends
- California Homicides: Rates Per 100K
- Florida Murder Rate: Statistics and Trends
- Gun Ownership by Political Party
- Mass Shooters by Gender
- U.S. Hunting and Fishing Statistics
- Where Are Silencers Illegal? State Suppressor Laws
- How Loud is a Gunshot?