U.S. Hunting & Fishing Statistics (2026 Data)
Section 1: Hunting & Fishing License Sales & Youth Participation Statistics
Hunting License Numbers Issued by State
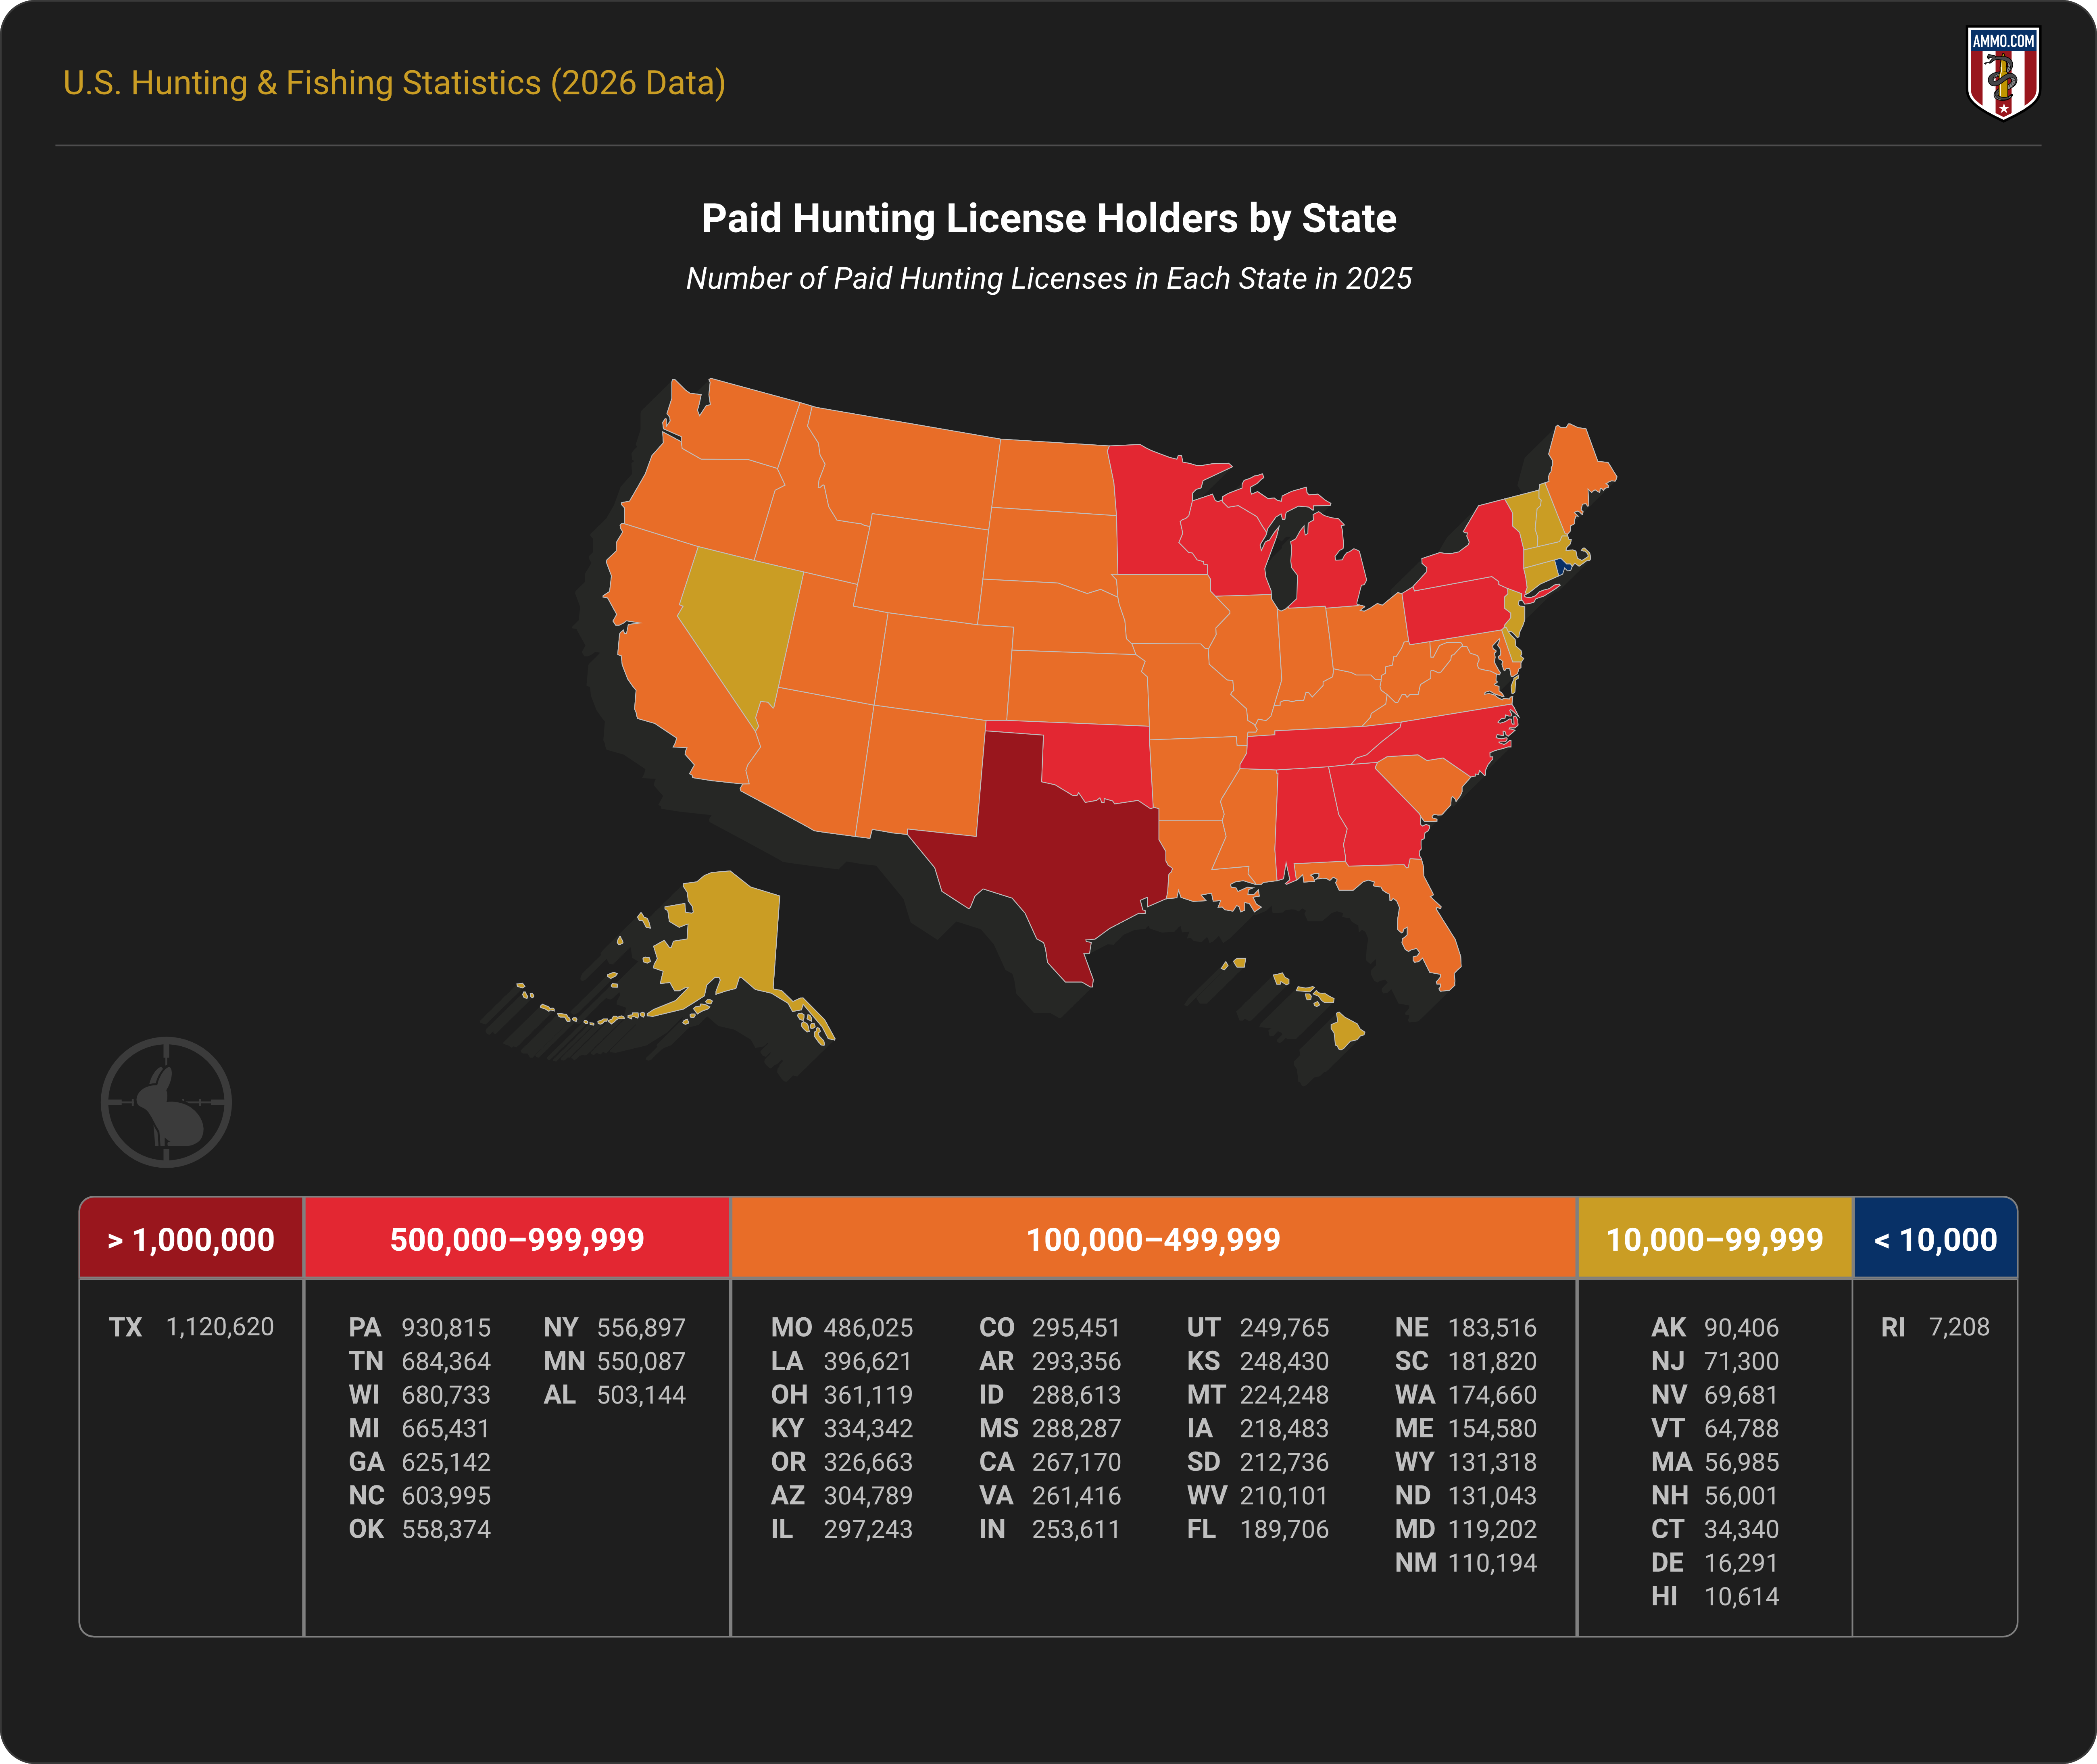
According to the Tracking and Reporting Actions for the Conservation of Species (TRACS)1, 15,650,606 paid hunting licenses were issued in the U.S. in 2023. Texas issued the most licenses (1,110,678), followed by Pennsylvania, Georgia, Tennessee, and Wisconsin.
Rhode Island issued the fewest paid licenses (7,529), followed by Vermont, Connecticut, Delaware, and Hawaii.
Fishing License Numbers Issued by State
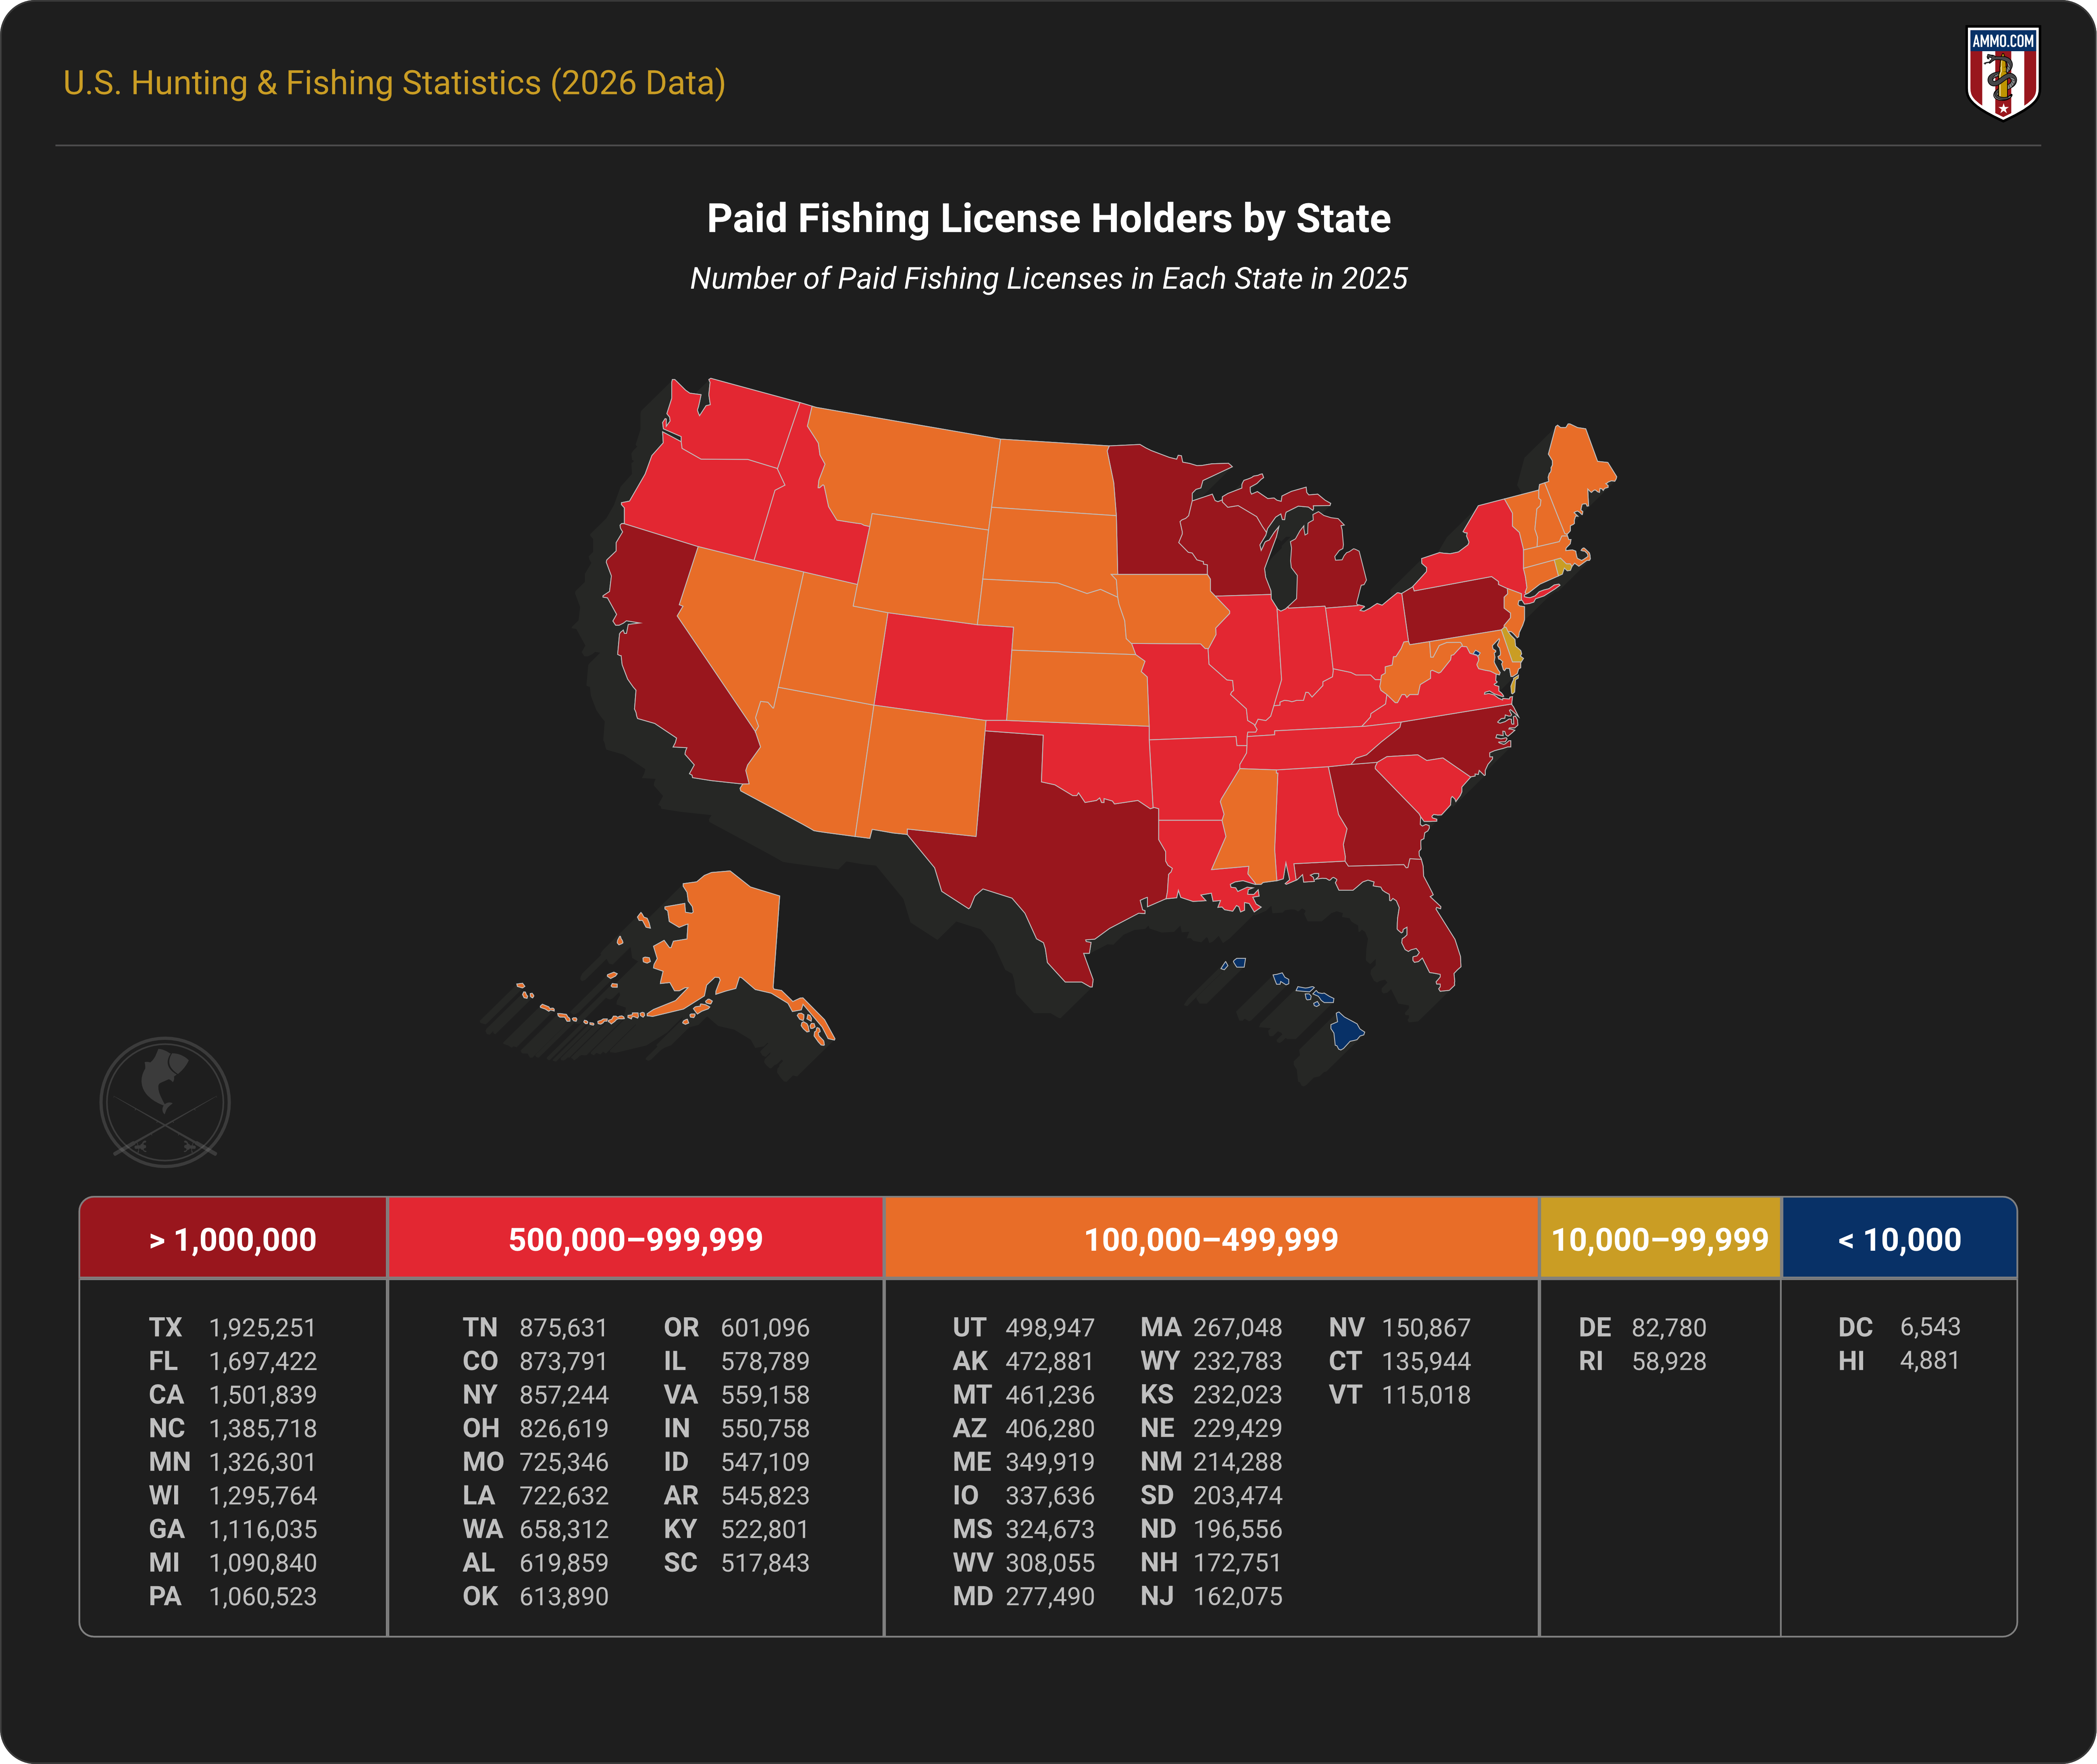
The TRACS database states that 29,499,174 paid fishing licenses were issued in the U.S. in 2023. Texas issued the most (1,925,251), followed by Florida, California, North Carolina, and Minnesota.
Hawaii issued the fewest paid fishing licenses (4,881), followed by Rhode Island, Delaware, Vermont, and Connecticut.1
Youth Participation Data
Youth participation in fishing increased by 14% from 2022 to 2023. In 2022, 4.9 million youth anglers (ages 13-17) participated in fishing activities. That number rose to 5.6 million in 2023.2
Youth hunting data in the U.S. are largely unavailable because states often allow youth hunters to participate without a license. The U.S. Fish and Wildlife Service issued reports in 2001 and 2006 showing that youth hunters (ages 6-15) made up 10.9% and 11.3% (approximately 1.6 million total) of all hunting participants during those respective years.3
Section 2: Fish Catch & Overfishing Statistics
How Much Fish Is Caught by Industry vs. Individuals?
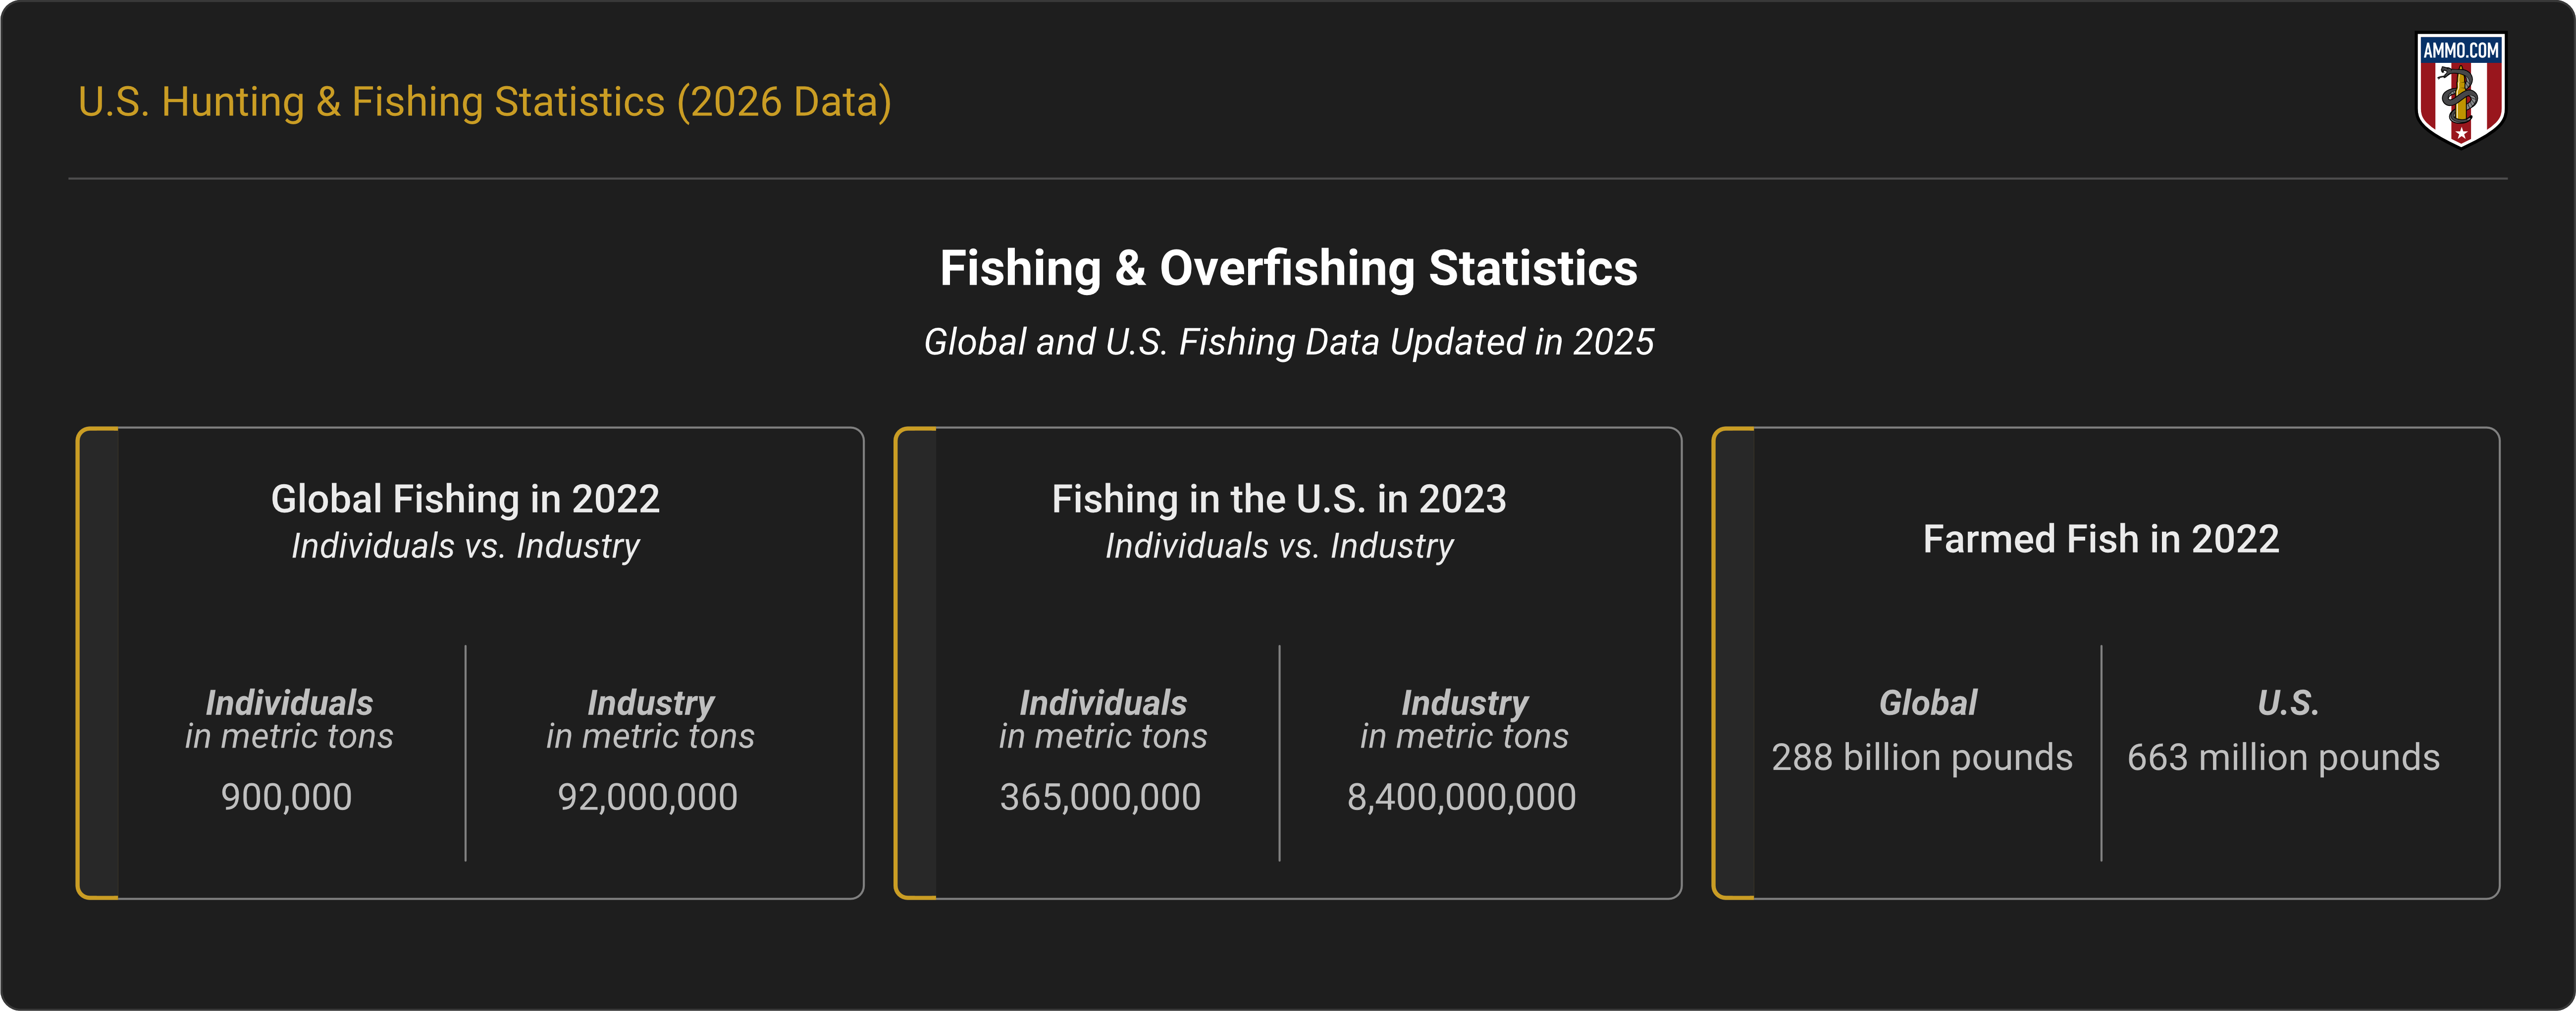
The National Oceanic and Atmospheric Administration (NOAA) reported 8.4 billion pounds of fish caught by industry in the U.S. in 2023.4 The same report suggests that 364 million pounds of fish were caught recreationally (i.e. by individuals) during that same year.
The Food and Agriculture Organization of the United Nations (FAO) estimates that commercial and industrial fishing accounted for 92 million metric tons of wild-caught fish in 2022. Research suggests that recreational fishing accounts for less than 1% of global marine catch; roughly 900,000 metric tons annually.5, 6
Percentage of Fish That Is Farmed
Per the latest available data from 2022, 51% (288 billion pounds) of global seafood production was farmed. In contrast, 7-8% (663 million pounds) was farmed in the U.S. that same year.7
Which Countries Are Overfishing the Most?
"Overfishing" refers to the removal of marine life from an area faster than wild populations can replenish. China, Indonesia, India, Russia, and the U.S. account for the top five countries in wild-caught fish and marine life production, although high yields alone do not indicate overfishing.8
Regionally, the Mediterranean Sea is widely considered the most overfished marine region in the world, with estimates suggesting that 58% of stock is overfished.9 In the Southeast Pacific, FAO assessments indicate that more than half of fish stocks are overfished.
Overfishing in the Mediterranean is largely driven by fleets from Italy, Greece, Spain, Turkey, Tunisia, and Croatia, which account for much of the region's fishing activity. Overfishing in the Southeast Pacific is largely associated with fisheries off the coasts of Peru and Chile, whose fleets account for most fishing activity in the region.10
Section 3: Mercury in Fish, Sources, and Global Emissions Data
Although overfishing can be mitigated through regulations and responsible stock management, even perfectly regulated harvests are subject to environmental factors that affect conservation efforts and marine ecosystem health.
One example of these environmental threats is mercury contamination, which enters aquatic ecosystems through industrial pollution and accumulates in fish throughout the food chain.
Where Mercury in Fish Comes From
Mercury is a naturally occurring element found in bodies of water worldwide. Industrial pollution (such as coal combustion and waste incineration) can increase mercury levels in the environment.
When mercury enters rivers, lakes, and oceans, microorganisms convert it into a toxic compound called "methylmercury." Small aquatic organisms absorb methylmercury, small fish eat those organisms, and larger fish then eat the smaller fish, causing mercury to build up throughout the food chain.11
Countries That Are the Biggest Mercury Polluters
Globally, mercury pollution is most closely associated with coal burning and gold mining. China, Indonesia, India, Peru, and Brazil are among the largest contributors. A 2025 study of global mercury emissions suggests that these five countries contribute half of the world's mercury pollution.
China produces the most mercury pollution with 566 metric tons per year, followed by India (264), Indonesia (148), Peru (144), and Brazil (85).12
Section 4: How Hunting and Fishing Fund Their Own Conservation Systems
The Pittman–Robertson Act: How Ammunition Funds Wildlife Restoration
Congress passed the Pittman–Robertson Federal Aid in Wildlife Restoration Act in 1937. The law directs federal excise taxes on firearms, ammunition, and archery equipment toward wildlife conservation initiatives.
An 11% tax on most firearms, ammunition and archery equipment, and a 10% tax on handguns, help fund wildlife restoration programs spearheaded by the U.S. Fish and Wildlife Service.
How Pittman–Robertson Funds Are Distributed by State
Pittman–Robertson funds are distributed to state wildlife agencies according to a formula based on each state's land area and its number of licensed hunters. Half of the funding allocated is based on the state's land area. The other half is distributed according to its number of licensed hunters.
No state can receive more than 5.0% or less than 0.5% of the total funds. States must provide matching contributions covering at least 25% of project costs (often funded by hunting license sales).13
How Much Money Has the Pittman–Robertson Act Generated Since 1937?
According to the U.S. Fish and Wildlife Service, the Pittman-Robertson Act has generated more than $17 billion (unadjusted) for wildlife conservation since its passage. Funds collected under the law have supported wildlife habitat restoration, research, hunter education programs, and public shooting ranges nationwide.14
The Dingell–Johnson Act: The Fishing Equivalent
Congress passed the Federal Aid in Sport Fish Restoration Act (Dingell–Johnson Act) in 1950. The law directs federal excise taxes on fishing equipment and motorboat fuel toward fishery conservation programs administered through the U.S. Fish and Wildlife Service.
How Dingell–Johnson Funds Are Distributed by State
Funds collected through the Dingell–Johnson Act are distributed to state fish and wildlife agencies according to a formula based on the number of licensed anglers and the areas of each state's land and water.
Federal law places limits on allocations: no state may receive more than 5% or less than 1% of total funds. To receive funding, states must provide matching contributions covering at least 25% of project costs, with federal funds covering the remainder. These funds support fishery conservationism, aquatic habitat restoration, boating access, and aquatic education programs.15
How Much Money Has the Dingell–Johnson Act Generated Since 1950?
According to the U.S. Fish and Wildlife Service, the Dingell–Johnson Act has generated more than $12 billion (unadjusted) for fishery conservation, aquatic habitat restoration, education, and recreational boating access since its passage.
Wrap-Up
Hunting and fishing help feed people and are deeply rooted in cultures across the world. Conservation efforts help maintain healthy ecosystems, but responsible hunting, fishing, and industrial practices are all essential to sustaining fish and wildlife populations.
Sources
- Partner With A Payer (U.S. Fish and Wildlife Service Office of Conservation Investment)
- 2024: Special Report on Fishing
- Youth hunters a bright spot amid downturn
- Fisheries of the United States
- The State of World Fisheries & Aquaculture: 2024
- Estimating Global Catches of Marine Recreational Fisheries
- U.S. Department of Agriculture: Aquaculture
- Our World in Data: Fish & Overfishing
- World Wildlife Federation: Fisheries
- Conserve and Sustainably Use the Oceans, Sea, and Marine Resources for Sustainable Development
- How Does Mercury Get Into Fish?
- Declines in anthropogenic mercury emissions in the Global North and China offset by the Global South
- The Pittman-Robertson Wildlife Restoration Act explained
- U.S. Fish & Wildlife Service: Wildlife Restoration
- U.S. Fish & Wildlife Service: Sport Fish Restoration

Infographics
- Are Guns & Ammo The New Gold? Why More Americans Are Arming Themselves
- The Greatest Gun Salesman In America: President Barack Obama
- Shooting Straight: How Both Presidential Candidates Have Changed On Gun Control
- President Obama: (Still) The Greatest Gun Salesman in America
- An Inconvenient Truth: How The Obama Administration Became Earth's Largest Arms Dealer
- Armed Drones: President Obama's Weapon of Choice
- COVID-19 Data Study: Ammunition Sales Continue to Soar in Response to Coronavirus Panic
- Data Study: 18 Months of Ammo Sales during a Pandemic, Protests, and the Biden Presidency
- Data Study: U.S. Ammo Sales Surge Following Russian Invasion of Ukraine
- Most Gun-Friendly States
- Worst States to be a Gun Owner
- Children & Firearms: Definitions and Demographics Make All the Difference
- Urban Violent Crime & Legal Gun Ownership
- Gun-Free School Zone Laws & School Shootings
- Gun Control Laws and Enforcement Trends
- Gun Ownership by State
- How Many Gun Owners are in America?
- Concealed Carry Crime Stats
- Accidental Shooting Statistics: A Review of Unintentional Firearm Deaths
- America's Stolen Guns: A Silent Contributor to Gun Crimes in the U.S.
- Gun Violence Statistics: Comprehensive Look at the Data
- Gun Laws vs. Crime Rates: A Comprehensive Analysis
- Gun Death Statistics by Caliber: A Review of Calibers and Crime
- Anti-Gun Control Arguments: Facts Gun Control Lobby Suppress
- Guns in the Home Statistics: The Effects of Firearms in the Home
- Gun Deaths in the US: Analyzing At-Risk Demographics
- How Many Guns in the U.S.: All About America's Firearms
- Gun Facts in the U.S.: The Reality of Firearms in America
- Defensive Gun Use Statistics: America's Life-Saving Gun Incidents
- Correlation Between Mass Shootings and Prescription Drugs
- Gun Ownership by Gender: Closing the Gender Gap
- Murders by Weapon Type: Statistics
- Gun Violence Among Black Americans: Statistics
- The Ultimate Hunting Caliber Chart: Best Cartridge Per Species
- How Old Do You Have to be to Buy a Gun: A State Guide
- Most Popular Guns in the U.S.: The Must-Have Guns
- Stray Bullet Deaths: Accident and Injury Statistics
- Mass Shooters by Race: Demographics of Assailants
- Ammunition Limits By State: How Much Ammo Can You Buy?
- Why Do Americans Own Guns?
- How Many Americans Want Stricter Gun Laws?
- How Many Households in the U.S. Have a Gun?
- What Percentage of Gun Deaths are Suicides?
- Average Age of Mass Shooters in the U.S.
- Firearm Ownership in America by Year
- US Firearms Deaths Per Year: A Collective Report
- Percentage of Americans Owning Guns
- Texas Gun Ownership: Total Numbers, Trends, and Most Popular Guns
- Gun Ownership Statistics Colorado: Trends & Numbers
- Hunting Accident Statistics (Causes & Trends Per Year)
- Banned Guns & Ammo List: A Review by State
- 3D Printed Gun Laws By State
- How To Build a Home Shooting Range: The Ultimate Guide
- States With the Highest Murder Rates
- Best Self-Defense Weapons for Women
- Easiest States to Buy a Gun
- Cities with the Lowest Crime Rate
- Oregon Homicide Rates
- Chicago Homicide Rate
- How Much Does a Suppressor Reduce Noise
- Texas Homicides: Statistics and Trends
- California Homicides: Rates Per 100K
- Florida Murder Rate: Statistics and Trends
- Gun Ownership by Political Party
- Mass Shooters by Gender
- U.S. Hunting and Fishing Statistics
- Where Are Silencers Illegal? State Suppressor Laws
- How Loud is a Gunshot?
- What States Have the Strictest Gun Control?
- Causes of Mass Shootings in the U.S.