Chicago Homicide Rate: 2025 Analysis
Report Highlights: Chicago is a large city with a homicide rate higher than its peer cities.
-
Of the 11 most populous U.S. cities (over 1 million people), Chicago consistently has the highest homicide rate.
-
Chicago's average homicide rate is 27.1 per 100,000 residents (excluding justifiable homicide and involuntary manslaughter).
-
64% of Chicago's neighborhoods (49 of 77) had homicide rates above the national average between October 2024 and 2025.
-
Chicago's murder rate declined by 7.95% in 2024: much less than in other cities.
Related Studies: Cities With the Lowest Crime Rate, States With the Highest Murder Rate, Urban Violent Crime and Legal Gun Ownership
Ammo.com provides reliable information sourced from reputable databases. You can view the sources used in this article HERE.
Methodology
This report analyzes murder rates in Chicago, Cook County, Illinois, and other U.S. cities with high homicide rates.
Local databases were used for neighborhood-specific murder rates, which exclude justifiable homicides and involuntary manslaughter. The FBI's Crime Data Explorer was used to extract homicide rates from cities across the U.S., noting that it includes all homicides (e.g. justifiable homicide and involuntary manslaughter).
The CDC WONDER database was used to collect homicide rates between 1968 and 2024. However, only county-level data is reported in the WONDER database.
Note on Per Capita Rates:
Comparing Chicago's homicide rates to those of other jurisdictions is challenging, as per capita calculations can skew the reality of homicides in smaller jurisdictions. For example, Memphis, TN reported 249 murders in 2024, whereas Chicago reported nearly twice that many in the same year.
Memphis has a population of 613,207; Chicago, 2,638,698. When one person is murdered in Memphis, the per capita rate equals 0.16 per 100,000. Conversely, when one person is murdered in Chicago, the per capita rate equals 0.037 per 100,000.
We use per capita rates to explain how likely someone is to be affected by crime across varying population sizes. But Chicago is one of our nation's most populous cities, and must be compared to other large cities to provide an accurate picture of the effects of crime.
How Does Chicago Compare to National Numbers?
Chicago compares differently to other cities depending on their population sizes.
When compared to smaller cities, Chicago looks much safer despite having twice as many homicides. Conversely, when compared to cities with larger populations, Chicago’s homicide rates appear more normalized.
Is Chicago More Dangerous Than Other Cities?
Chicago is the most dangerous city among its peer cities. Of the 11 U.S. cities with populations over 1,000,000 people in 2024, Chicago's homicide rate is two to four times higher than most others. Source 1
Chicago's homicide rate in 2024 was 17.5 per 100,000 people (including justifiable homicide and involuntary manslaughter), which is more than four times that of New York City and nearly three times more than Los Angeles. Of the 1 million+ population cities, Philadelphia is the only one that comes close to Chicago's homicide rate (16.9 per 100,000).
Although cities like Houston and Dallas also have double-digit homicide rates, Chicago is an outlier due to the combination of its large population and high homicide rate.
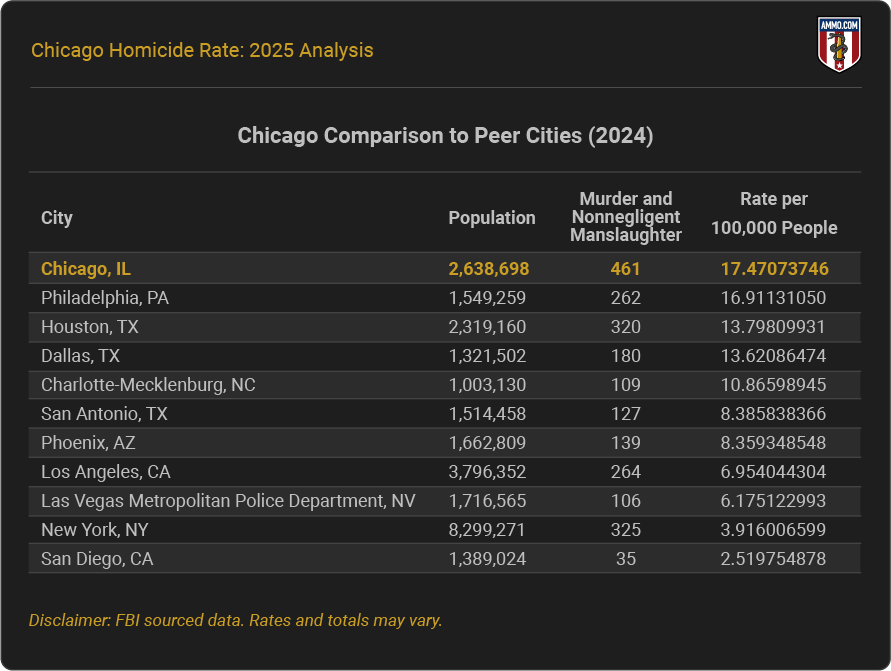
Note: Although New York and Los Angeles have much higher populations, those cities reported fewer murders than Chicago in 2024.
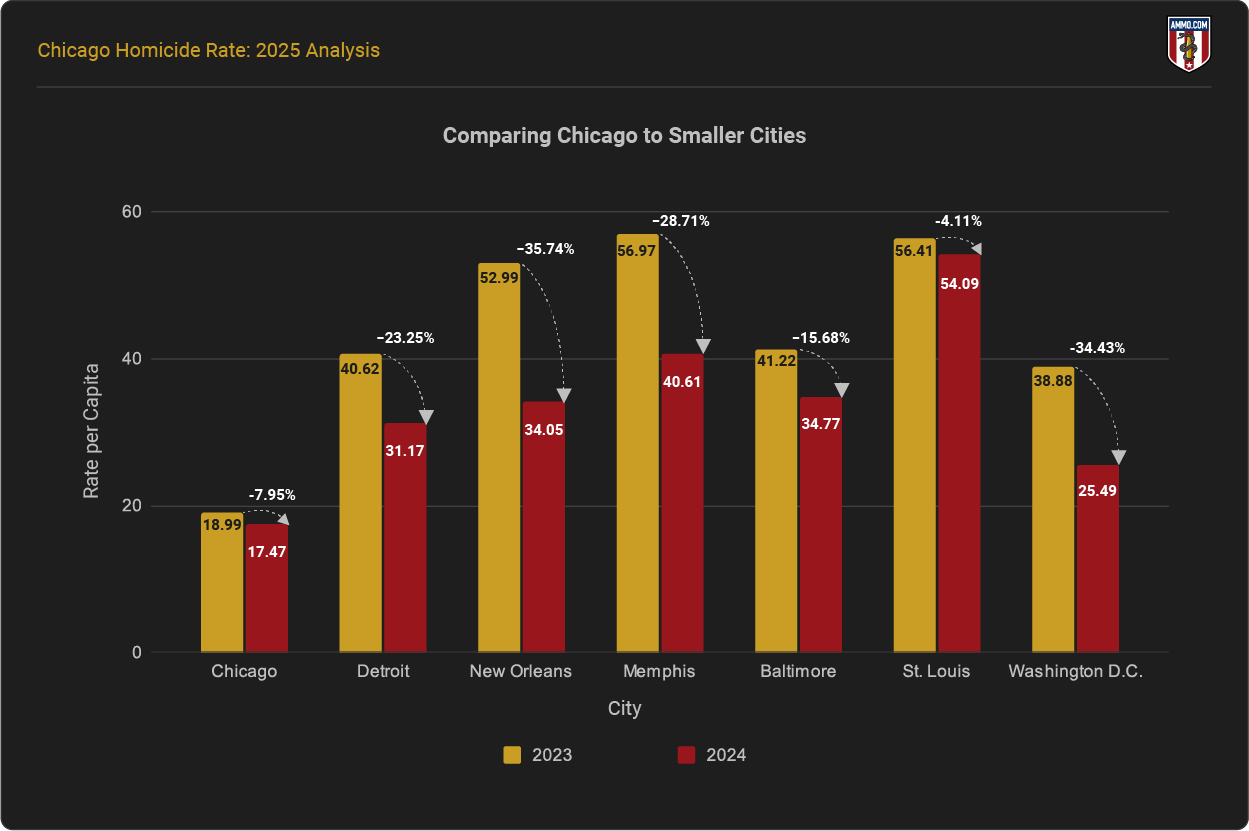
Comparing Chicago to Smaller Cities
New Orleans, Washington, D.C., Memphis, Detroit, and Baltimore are among cities with the highest murder rates in the country. With an average population size of 579,491 between these cities, one homicide has a higher impact on per capita rates than a large metro like Chicago. Source 1
The aforementioned five cities had an average murder rate of 46.14 per 100,000 in 2024, and an average of 258.2 total homicides. Had Chicago reported the same number of homicides, its murder rate would become only 9.82 per 100,000 in the same year. This illustrates the statistical impact of its large population.
In reality, Chicago reported nearly twice the number of murders as smaller cities with higher homicide rates in 2024. Furthermore, the five cities with the highest murder rates also experienced significant declines in homicides over the past year, whereas Chicago's rate remained static.
Homicide Trends in Cook County, IL
Cook County, Illinois (in which Chicago is located) has historically had a murder rate above the national average, often by a wide margin. Sources 3, 4, 5
For this section, we relied on CDC WONDER because it is the most consistent database with regard to accuracy and trends. However, the WONDER database only reports county-level data. It should therefore be understood that the data listed here is representative of the city of Chicago and the surrounding area as well.
As the national murder rate rises, so too does Cook County's. However, Cook County's rate has been higher, historically, in more peaceful periods than those of most other counties in the U.S.
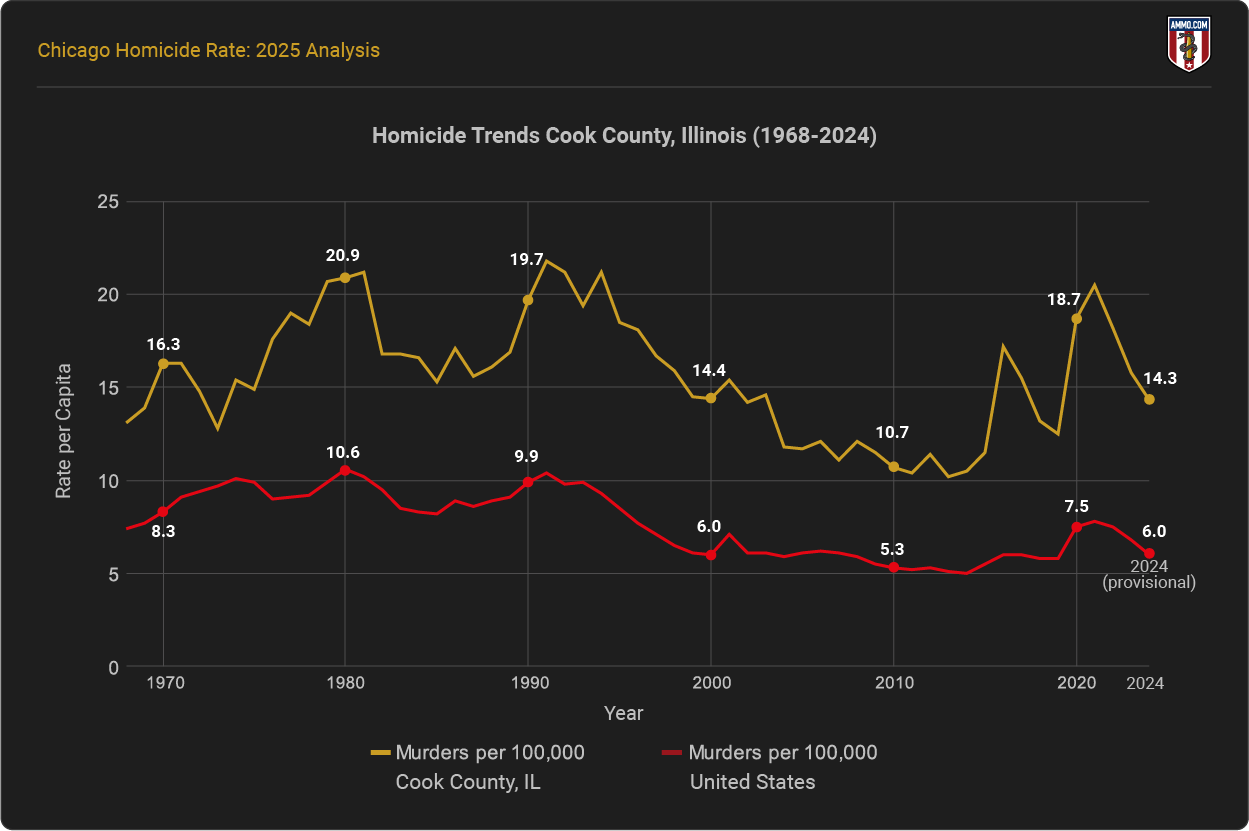
Table and Title: Homicide Trends in Cook County IL (1968-2024)
Homicides in Chicago Neighborhoods
Chicago's high homicide rates affect 67% of the city's communities. Forty-nine of the 77 clearly defined neighborhoods in Chicago have homicide rates above the national average.
West Garfield Park had the average homicide rate over the past three years at 134 murders per 100,000 people. Greater Grand Crossing had the highest homicide rate over the past year (October 2024-2025) at 93 murders per 100,000. Source 2
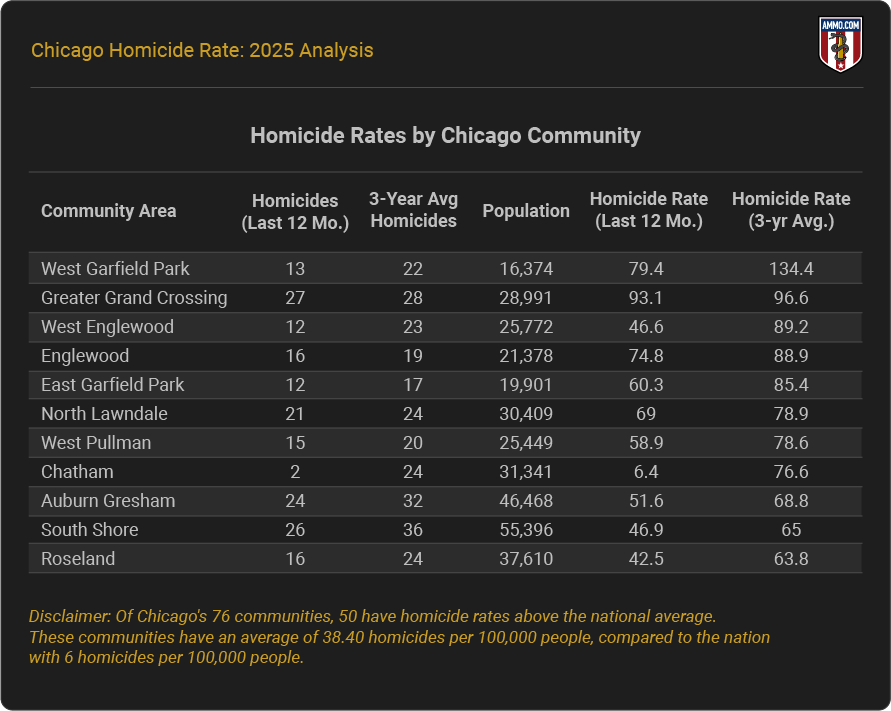
Note: Murders in this section exclude justifiable and involuntary homicide.
Wrap-Up
Chicago consistently has more murders than any other city in the United States. Compared to other large metros, the city has much higher homicide rates. However, when compared to smaller cities, Chicago appears to perform better.
Sources:
- Offenses Known to Law Enforcement (2024)
- ABC7 Chicago Neighborhood Safety Tracker
- National Center for Health Statistics Mortality Data on CDC WONDER
- About Provisional Mortality Statistics, 2018 through Last Week
- United States Census Bureau

Infographics
- Are Guns & Ammo The New Gold? Why More Americans Are Arming Themselves
- The Greatest Gun Salesman In America: President Barack Obama
- Shooting Straight: How Both Presidential Candidates Have Changed On Gun Control
- President Obama: (Still) The Greatest Gun Salesman in America
- An Inconvenient Truth: How The Obama Administration Became Earth's Largest Arms Dealer
- Armed Drones: President Obama's Weapon of Choice
- COVID-19 Data Study: Ammunition Sales Continue to Soar in Response to Coronavirus Panic
- Data Study: 18 Months of Ammo Sales during a Pandemic, Protests, and the Biden Presidency
- Data Study: U.S. Ammo Sales Surge Following Russian Invasion of Ukraine
- Most Gun-Friendly States
- Worst States to be a Gun Owner
- Children & Firearms: Definitions and Demographics Make All the Difference
- Urban Violent Crime & Legal Gun Ownership
- Gun-Free School Zone Laws & School Shootings
- Gun Control Laws and Enforcement Trends
- Gun Ownership by State
- How Many Gun Owners are in America?
- Concealed Carry Crime Stats
- Accidental Shooting Statistics: A Review of Unintentional Firearm Deaths
- America's Stolen Guns: A Silent Contributor to Gun Crimes in the U.S.
- Gun Violence Statistics: Comprehensive Look at the Data
- Gun Laws vs. Crime Rates: A Comprehensive Analysis
- Gun Death Statistics by Caliber: A Review of Calibers and Crime
- Anti-Gun Control Arguments: Facts Gun Control Lobby Suppress
- Guns in the Home Statistics: The Effects of Firearms in the Home
- Gun Deaths in the US: Analyzing At-Risk Demographics
- How Many Guns in the U.S.: All About America's Firearms
- Gun Facts in the U.S.: The Reality of Firearms in America
- Defensive Gun Use Statistics: America's Life-Saving Gun Incidents
- Correlation Between Mass Shootings and Prescription Drugs
- Gun Ownership by Gender: Closing the Gender Gap
- Murders by Weapon Type: Statistics
- Gun Violence Among Black Americans: Statistics
- The Ultimate Hunting Caliber Chart: Best Cartridge Per Species
- How Old Do You Have to be to Buy a Gun: A State Guide
- Most Popular Guns in the U.S.: The Must-Have Guns
- Stray Bullet Deaths: Accident and Injury Statistics
- Mass Shooters by Race: Demographics of Assailants
- Ammunition Limits By State: How Much Ammo Can You Buy?
- Why Do Americans Own Guns?
- How Many Americans Want Stricter Gun Laws?
- How Many Households in the U.S. Have a Gun?
- What Percentage of Gun Deaths are Suicides?
- Average Age of Mass Shooters in the U.S.
- Firearm Ownership in America by Year
- US Firearms Deaths Per Year: A Collective Report
- Percentage of Americans Owning Guns
- Texas Gun Ownership: Total Numbers, Trends, and Most Popular Guns
- Gun Ownership Statistics Colorado: Trends & Numbers
- Hunting Accident Statistics (Causes & Trends Per Year)
- Banned Guns & Ammo List: A Review by State
- 3D Printed Gun Laws By State
- How To Build a Home Shooting Range: The Ultimate Guide
- States With the Highest Murder Rates
- Best Self-Defense Weapons for Women
- Easiest States to Buy a Gun
- Cities with the Lowest Crime Rate
- Oregon Homicide Rates
- Chicago Homicide Rate
- How Much Does a Suppressor Reduce Noise
- Texas Homicides: Statistics and Trends
- California Homicides: Rates Per 100K
- Florida Murder Rate: Statistics and Trends
- Gun Ownership by Political Party
- Mass Shooters by Gender
- U.S. Hunting and Fishing Statistics
- Where Are Silencers Illegal? State Suppressor Laws
- How Loud is a Gunshot?
- What States Have the Strictest Gun Control?
- Causes of Mass Shootings in the U.S.