Oregon Homicide Rates: 2025 Analysis
Report Highlights: In 2024, Oregon had lower homicide rates than the national average. However, crime in Oregon is concentrated in Portland.
-
In 2024, Oregon’s homicide rate was 32% lower than the national average.
-
Portland has the highest violent crime rate in Oregon at 720 victimizations per 100,000.
-
Portland, Oregon ranks 6th in violent crime among ten cities with similar populations.
Related Studies: States with the Highest Murder Rate | Cities with the Lowest Crime Rates | Gun Ownership by State
Ammo.com reports are informed by reputable and reliable databases. You can view our sources HERE.
Methodology
Data in this report is sourced from the CDC WONDER Database and FBI Crime Data Explorer. The WONDER Database was used to retrieve state and national homicide rates, while the FBI Crime Database was used to retrieve city-level data.
This analysis compares Portland’s violent crime rates (which include homicide) to other intrastate and interstate cities using FBI data, and Oregon to states with similar policies (e.g. sanctuary vs. non-sanctuary states) and similar population sizes using the WONDER Database.
Homicide rates include justifiable homicides, and were compared using unweighted state-level averages. Each state contributes equally to the category totals, whether classified as a sanctuary or non-sanctuary state.
Oregon Homicide Rates
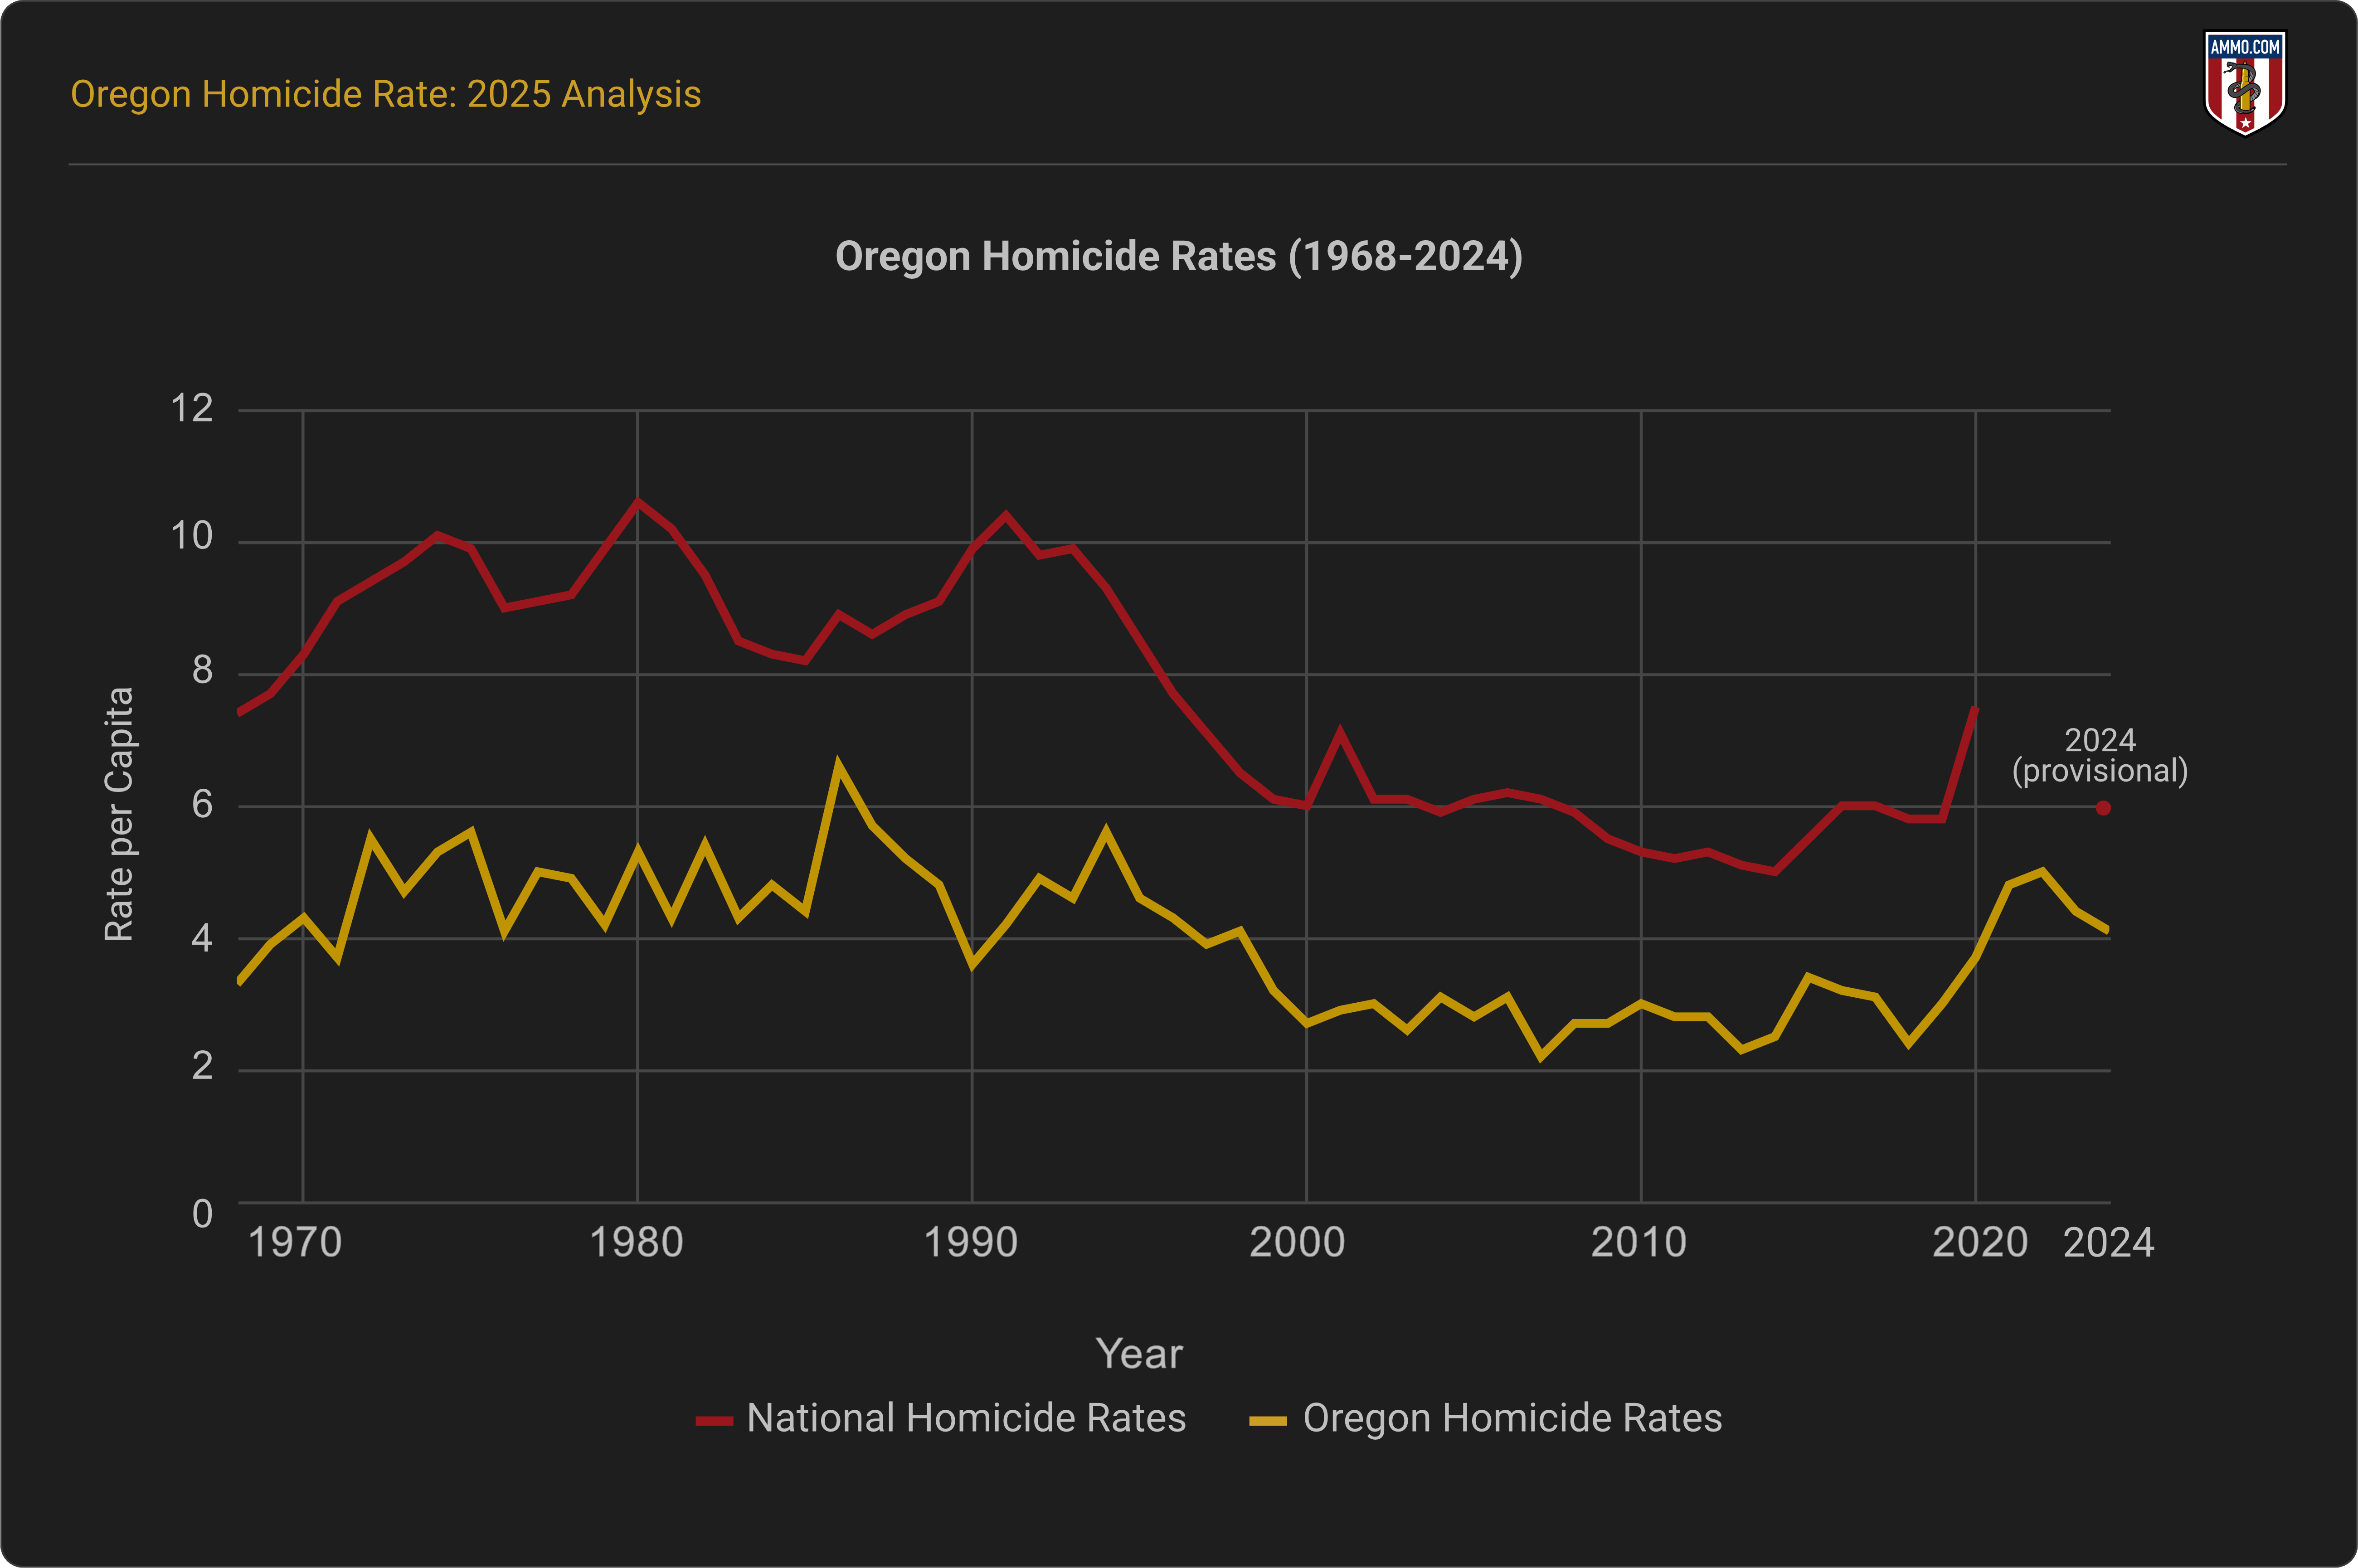
Oregon consistently reports lower homicide rates than the national average. In 2024, the state’s homicide rate was 32% lower than the national average.
Oregon Murder Rate Per Capita
Oregon’s homicide rate increased in the 1970s and 1980s, with the highest homicide rate occurring in 1986 (6.6 per 100,000 people). In 2024, Oregon ranked 37th for homicides in the U.S. at 4.1 per 100,000, with 174 total murders reported to the CDC. 2, 3, 4
Comparatively speaking, New Hampshire had the lowest homicide rate in 2024, followed by Idaho, Rhode Island, Massachusetts, and Maine (below 2.4 per 100,000). Washington, D.C., Mississippi, Louisiana, New Mexico, and Alabama rounded out the top five states with the highest homicide rates that same year.

Oregon Homicide Rates by Year
Although fluctuating over the past five decades, long-term trends show that Oregon’s homicide rates remain relatively low and stable compared to national patterns. Between the 1960s and 1990s, Oregon’s homicide rates ranged from 3 to 5 per 100,000 residents. 2, 3, 4
The state’s homicides remained low between 2000 and 2014, with rates between 2 and 3 per 100,000. They then rose during the COVID-19 pandemic, which aligns with national averages.
In 2024, Oregon’s homicide rate was 36.7% higher than pre-pandemic levels; the national rate, 3.45% higher.
Oregon Murder Rate Compared to Other States
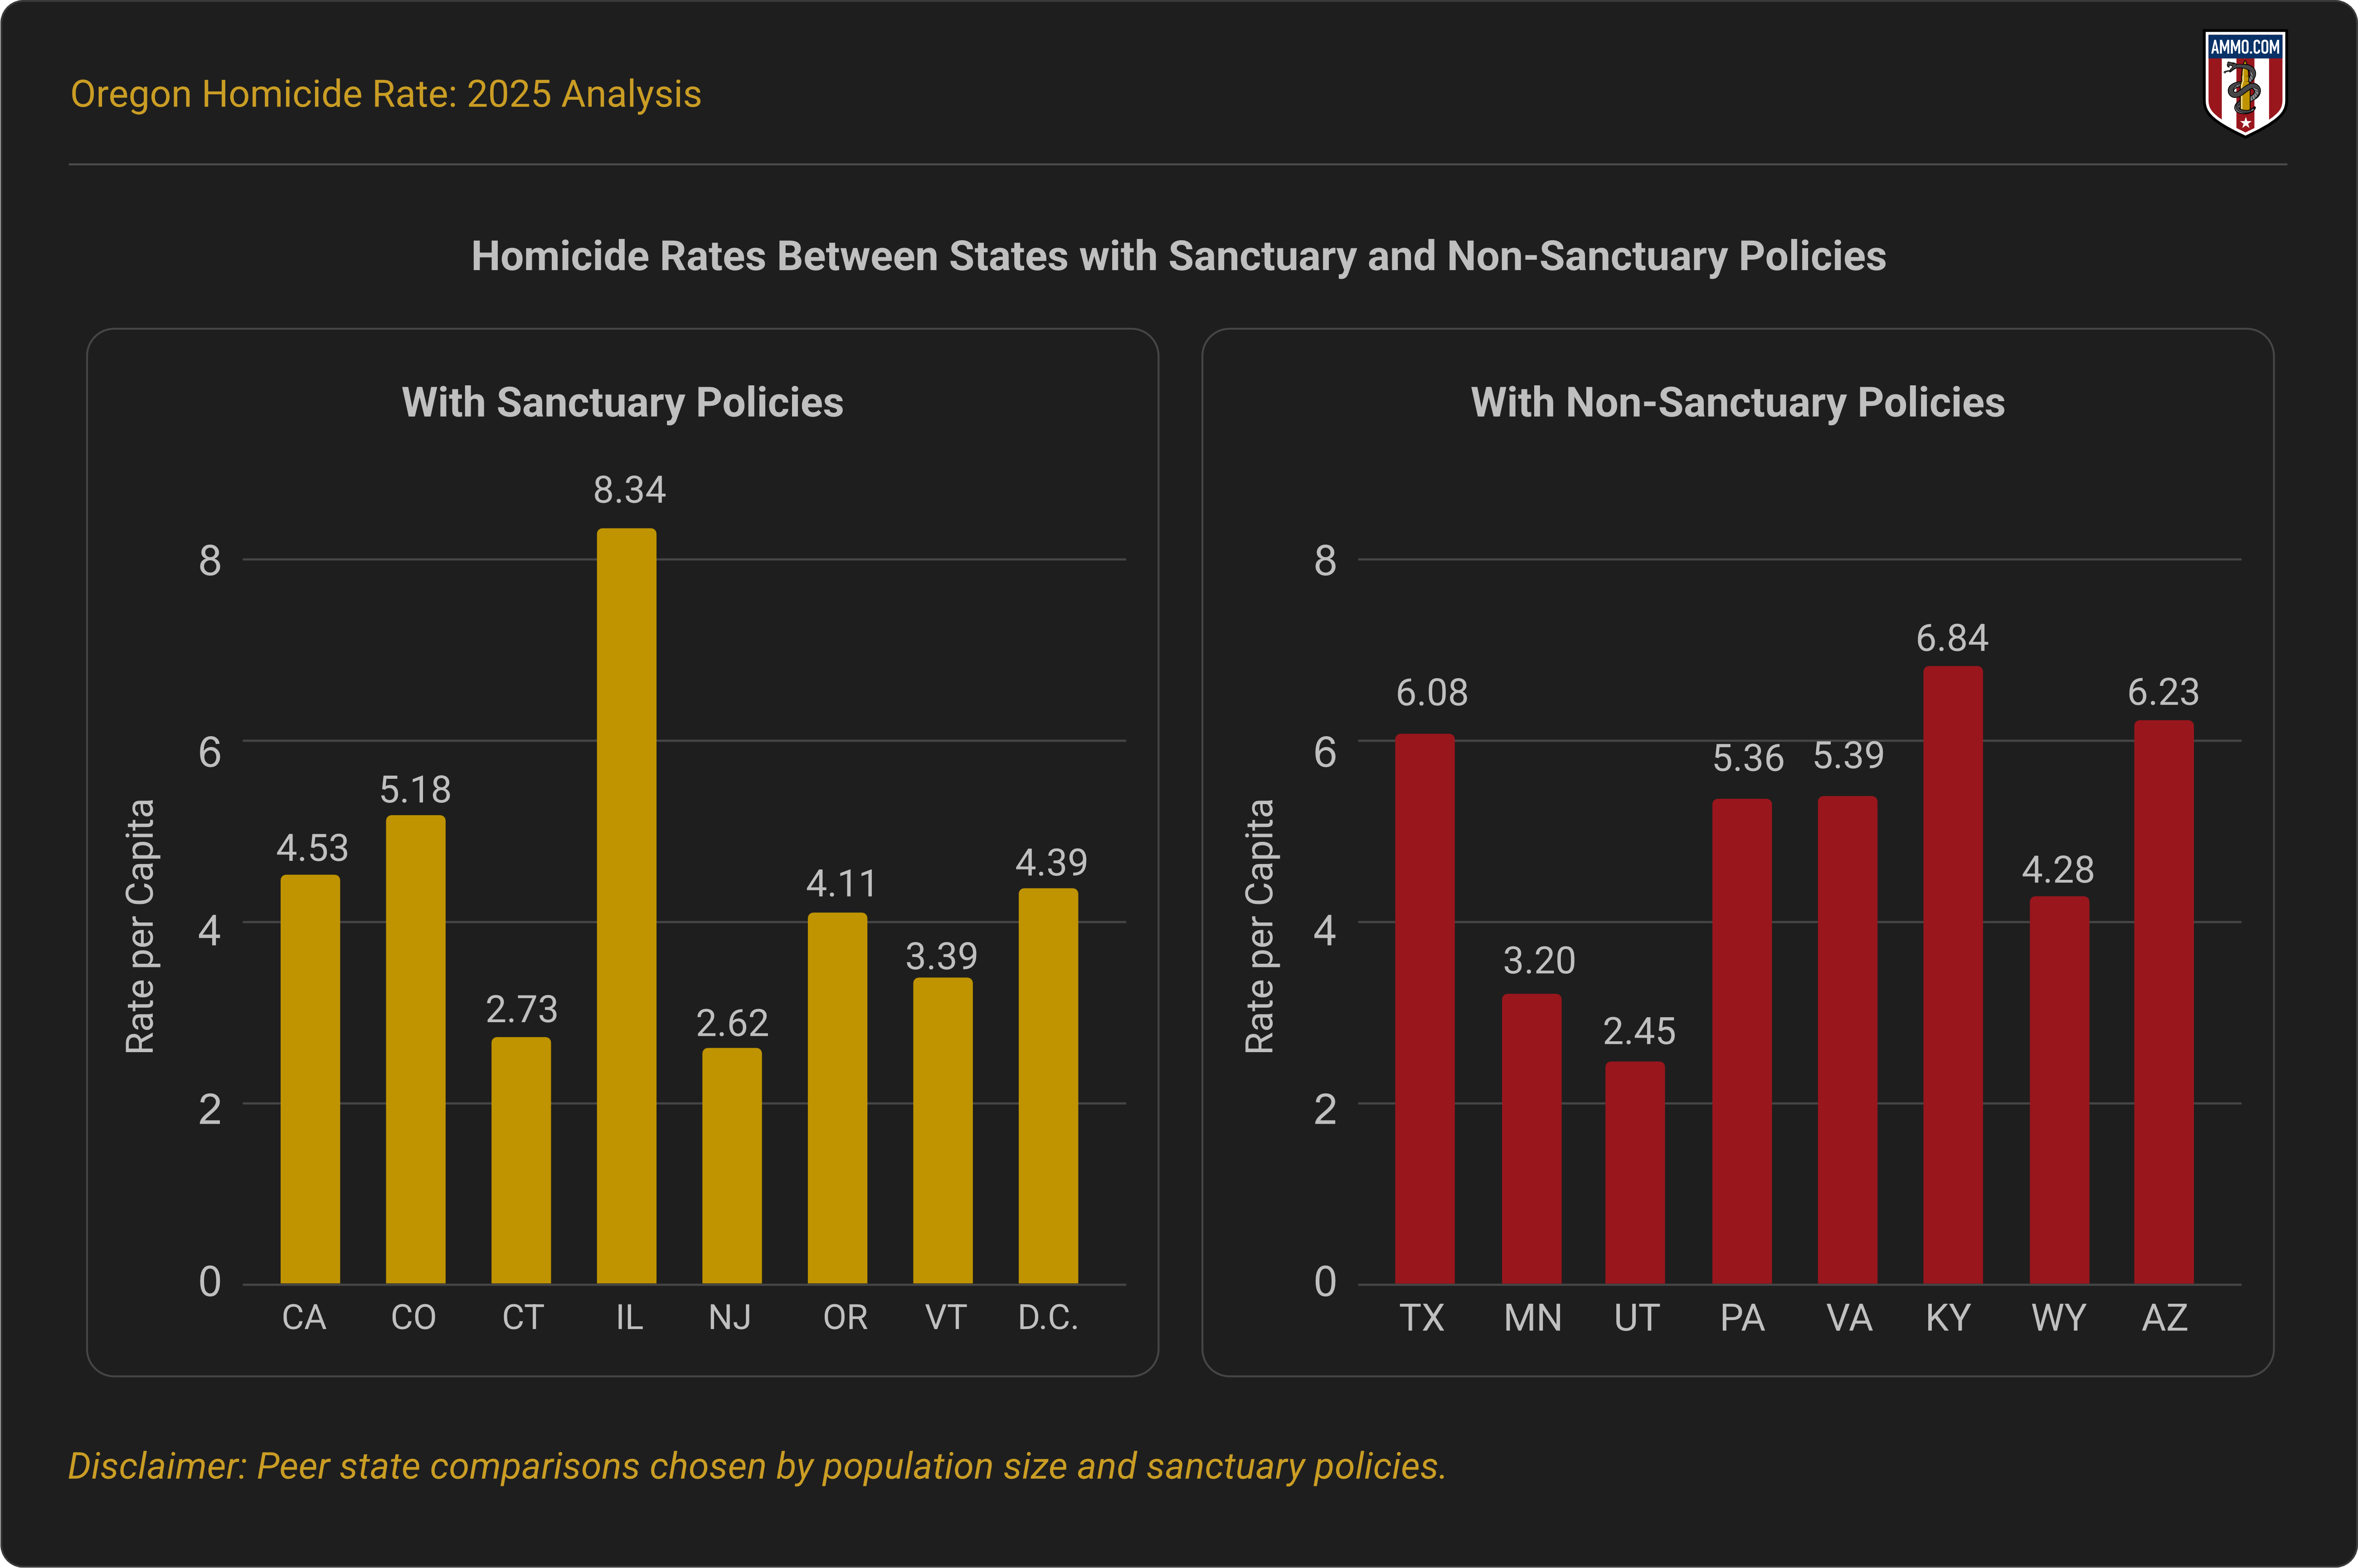
Oregon's 2024 homicide rate remained below the national average (6.0 per 100,000 people) at 4.1 per 100,000, and aligned closely with nearby states including Washington (4.4 per 100,000) and Colorado (5.2 per 100,000).2, 3, 4
Compared to other sanctuary states, including California (4.5 per 100,000) and Illinois (8.3 per 100,000), Oregon continues to report lower homicide rates. Oregon also has lower rates compared to non-sanctuary states such as Kentucky (6.8 per 100,000) and Arizona (6.2 per 100,000), yet higher rates than Utah (2.5 per 100,000).
Similar to the rest of the United States, Oregon experienced a sharp increase in homicides during the COVID-19 pandemic (46.7%), followed by a gradual decline. The state's homicide rate fell by 6% between 2023 and 2024, while comparable states exhibited steeper declines.
Homicide Rates by Oregon Cities
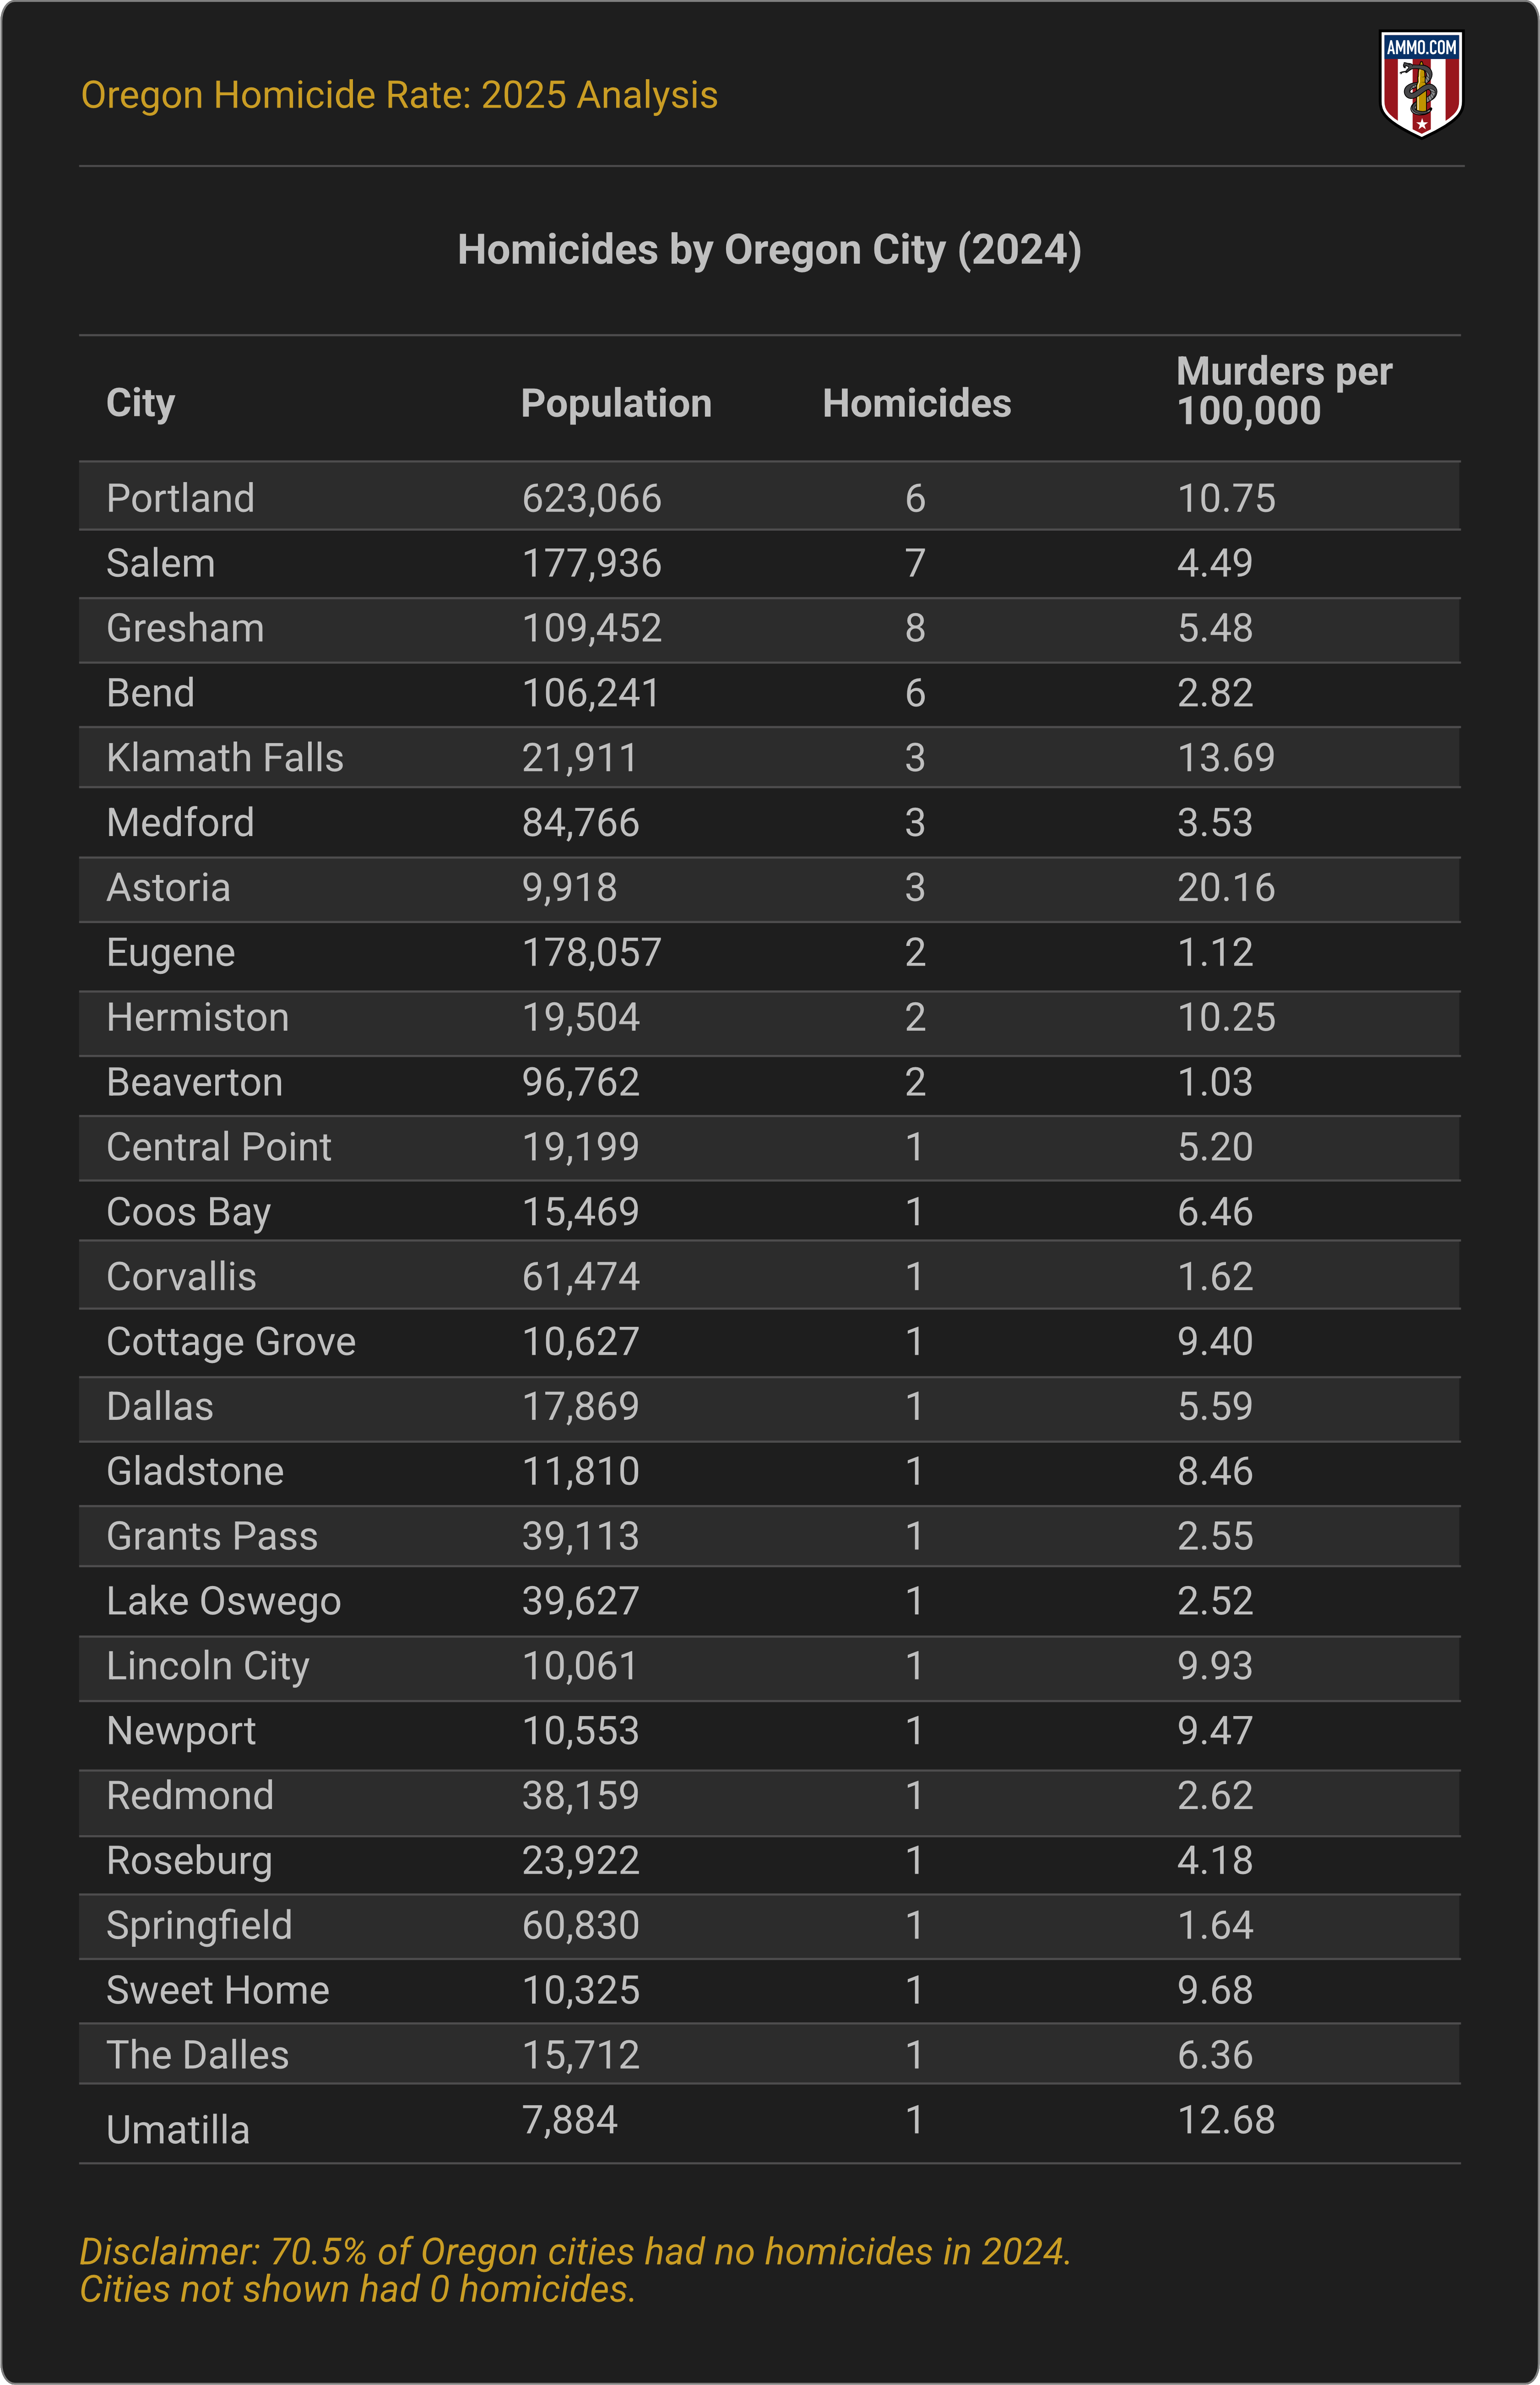
With a concentration of violence in the city, Portland's homicide rate in 2024 was 10.8 per 100,000. Similar patterns arise when we compare only homicides across the state. Homicide data shows a similar concentration of violence in Portland. Of the 149 homicides reported to the FBI in 2024, 45% (67) happened in Portland, yielding a rate of 10.8 homicides per 100,000 people.
Although Astoria (20.17 per 100,000 people) and Umatilla (12.68 per 100,000) show higher homicide rates than Portland, these cities experienced 2 two and 1 one homicides in 2024, respectively. Salem (4.5 per 100,000), Gresham (5.5 per 100,000), and Medford (3.5 per 100,000) have homicide rates of less than half of Portland's, while having more murders in 2024 than other Oregon cities.
Portland reported the most violent crimes in Oregon in 2024 (4,487). This equates to 720 victimizations per 100,000 people: more than double the statewide average (237.57 per 100,000).1
Salem and Medford have lower violent crime rates than Portland – but higher than others, with violent crime rates of 532 and 492 per 100,000, respectively. Smaller cities such as Eugene (318 per 100,000), Hillsboro (318 per 100,000), and Beaverton (365 per 100,000) also have violent crime rates above the state's average.
How Does Portland Compare to Similar Cities?
According to the FBI, Portland ranks 6th for violent crime among 10 of its peer cities (i.e. cities with similar population sizes).1
Memphis, TN is the most dangerous of these 10, with 2,501.28 victimizations per 100,000 people. Detroit, MI, Baltimore, MD, Milwaukee, WI, and Albuquerque, NM round out the top 5, while Portland has more violent crimes than Louisville, KY, Boston, MA, Tucson, AZ, and El Paso, TX.

Wrap-Up
Although Oregon is one of the safest states in the U.S., Portland has a high concentration of violent crime (including homicides). Compared to other states with similar population sizes, sanctuary status has no impact on homicide rates. Furthermore, interstate comparisons of other cities show no direct causal link between immigration policy and violent crime.
Sources:
- FBI Crime Data Explorer
- National Center for Health Statistics Mortality Data on CDC WONDER
- CDC WONDER Underlying Cause of Death by Bridged Race Categories
- CDC WONDER Underlying Cause of Death 2018-2023
- CDC Provisional Mortality Statistics

Infographics
- Are Guns & Ammo The New Gold? Why More Americans Are Arming Themselves
- The Greatest Gun Salesman In America: President Barack Obama
- Shooting Straight: How Both Presidential Candidates Have Changed On Gun Control
- President Obama: (Still) The Greatest Gun Salesman in America
- An Inconvenient Truth: How The Obama Administration Became Earth's Largest Arms Dealer
- Armed Drones: President Obama's Weapon of Choice
- COVID-19 Data Study: Ammunition Sales Continue to Soar in Response to Coronavirus Panic
- Data Study: 18 Months of Ammo Sales during a Pandemic, Protests, and the Biden Presidency
- Data Study: U.S. Ammo Sales Surge Following Russian Invasion of Ukraine
- Most Gun-Friendly States
- Worst States to be a Gun Owner
- Children & Firearms: Definitions and Demographics Make All the Difference
- Urban Violent Crime & Legal Gun Ownership
- Gun-Free School Zone Laws & School Shootings
- Gun Control Laws and Enforcement Trends
- Gun Ownership by State
- How Many Gun Owners are in America?
- Concealed Carry Crime Stats
- Accidental Shooting Statistics: A Review of Unintentional Firearm Deaths
- America's Stolen Guns: A Silent Contributor to Gun Crimes in the U.S.
- Gun Violence Statistics: Comprehensive Look at the Data
- Gun Laws vs. Crime Rates: A Comprehensive Analysis
- Gun Death Statistics by Caliber: A Review of Calibers and Crime
- Anti-Gun Control Arguments: Facts Gun Control Lobby Suppress
- Guns in the Home Statistics: The Effects of Firearms in the Home
- Gun Deaths in the US: Analyzing At-Risk Demographics
- How Many Guns in the U.S.: All About America's Firearms
- Gun Facts in the U.S.: The Reality of Firearms in America
- Defensive Gun Use Statistics: America's Life-Saving Gun Incidents
- Correlation Between Mass Shootings and Prescription Drugs
- Gun Ownership by Gender: Closing the Gender Gap
- Murders by Weapon Type: Statistics
- Gun Violence Among Black Americans: Statistics
- The Ultimate Hunting Caliber Chart: Best Cartridge Per Species
- How Old Do You Have to be to Buy a Gun: A State Guide
- Most Popular Guns in the U.S.: The Must-Have Guns
- Stray Bullet Deaths: Accident and Injury Statistics
- Mass Shooters by Race: Demographics of Assailants
- Ammunition Limits By State: How Much Ammo Can You Buy?
- Why Do Americans Own Guns?
- How Many Americans Want Stricter Gun Laws?
- How Many Households in the U.S. Have a Gun?
- What Percentage of Gun Deaths are Suicides?
- Average Age of Mass Shooters in the U.S.
- Firearm Ownership in America by Year
- US Firearms Deaths Per Year: A Collective Report
- Percentage of Americans Owning Guns
- Texas Gun Ownership: Total Numbers, Trends, and Most Popular Guns
- Gun Ownership Statistics Colorado: Trends & Numbers
- Hunting Accident Statistics (Causes & Trends Per Year)
- Banned Guns & Ammo List: A Review by State
- 3D Printed Gun Laws By State
- How To Build a Home Shooting Range: The Ultimate Guide
- States With the Highest Murder Rates
- Best Self-Defense Weapons for Women
- Easiest States to Buy a Gun
- Cities with the Lowest Crime Rate
- Oregon Homicide Rates
- Chicago Homicide Rate
- How Much Does a Suppressor Reduce Noise
- Texas Homicides: Statistics and Trends
- California Homicides: Rates Per 100K
- Florida Murder Rate: Statistics and Trends
- Gun Ownership by Political Party
- Mass Shooters by Gender
- U.S. Hunting and Fishing Statistics
- Where Are Silencers Illegal? State Suppressor Laws
- How Loud is a Gunshot?
- What States Have the Strictest Gun Control?
- Causes of Mass Shootings in the U.S.