How Criminals Get Guns: A 2026 Report
From theft and underground sources to private transfers, criminals obtain guns using a variety of methods.
-
Only one in ten inmates who were armed during their crime obtained their firearms from a retail source, per a BJS report published in 2019.
-
The median time between a firearm purchase and a criminal investigation in 2023 was 2.9 years.
-
A 2024 UC Davis study found that stolen guns are nearly nine times more likely to be used in crimes than dealer-sold firearms that were not reported stolen.
Ammo.com provides reliable information from reputable sources. You can view all sources used in this article.
Methodology
This report draws on data from a variety of federal sources and peer-reviewed research to examine how criminals obtain firearms in the U.S.
The 2016 Bureau of Justice Statistics (BJS) Survey of Prison Inmates, published in January of 2019, was used to analyze how criminals get guns. The BJS collected self-reported data from 24,848 state and federal prisoners across 364 facilities through face-to-face interviews. Researchers weighted responses to produce national estimates. Of those surveyed, about one in five possessed a firearm during the offense for which they were serving time. The source figures in this report describe the armed subset (an estimated 256,400 prisoners nationally).
Prisoners were asked to report all sources through which they obtained firearms. Categories therefore are not mutually exclusive, and figures do not total 100%. Self-reported data may undercount acquisition methods. Additionally, this report captured data from convicted criminals and may not represent the broader criminal population.
The Bureau of Alcohol, Tobacco, Firearms and Explosives (ATF) National Firearms Commerce and Trafficking Assessment provides information on firearm tracing, trafficking, and thefts. These data allow us to examine a firearm's original point of sale during an investigation. The National Tracing Center (NTC) processes trace requests. “Armed prisoners,” as used in this report, refers to convicted criminals who possessed a firearm during the commission of their crime.
Additional data were drawn from a 2024 peer-reviewed study published in Injury Epidemiology by researchers at UC Davis and a 2023 report published by the Center for Justice Innovation.
The Difference Between a Traced Crime Gun and a Crime Gun
Crime guns and traced crime guns are two different things: those used in crime, and those traced during investigation, respectively.
A crime gun is one used to commit a crime. Investigators recover such a gun at the crime scene, or link it directly to the crime during the investigation. For that reason, researchers rely on inmate-survey data rather than trace data to understand how criminals actually obtain their guns.2
When a law enforcement agency recovers a firearm during an investigation, the gun’s serial number is traced. This does not necessarily mean the gun was used in a crime. Instead, investigators trace it to determine its origin and history. For example, a traced gun that was not used in a crime could be a firearm recovered during a search warrant for an unrelated crime.1, 3
The NTC processes law enforcement trace requests to the original point of sale. The traces do not always indicate that a firearm was used in a crime.
For how home-manufactured firearms fit into the tracing picture, see our guide to 3D printed firearms and ghost guns.
Where Do Criminals Actually Get Guns?
Criminals are rarely the initial purchasers of firearms. A Department of Justice report released in 2025 suggested that of nearly 1.3 million trace requests for firearm origins between 2022 and 2023, 56% had a different purchaser than the possessor at the time of the investigation.4
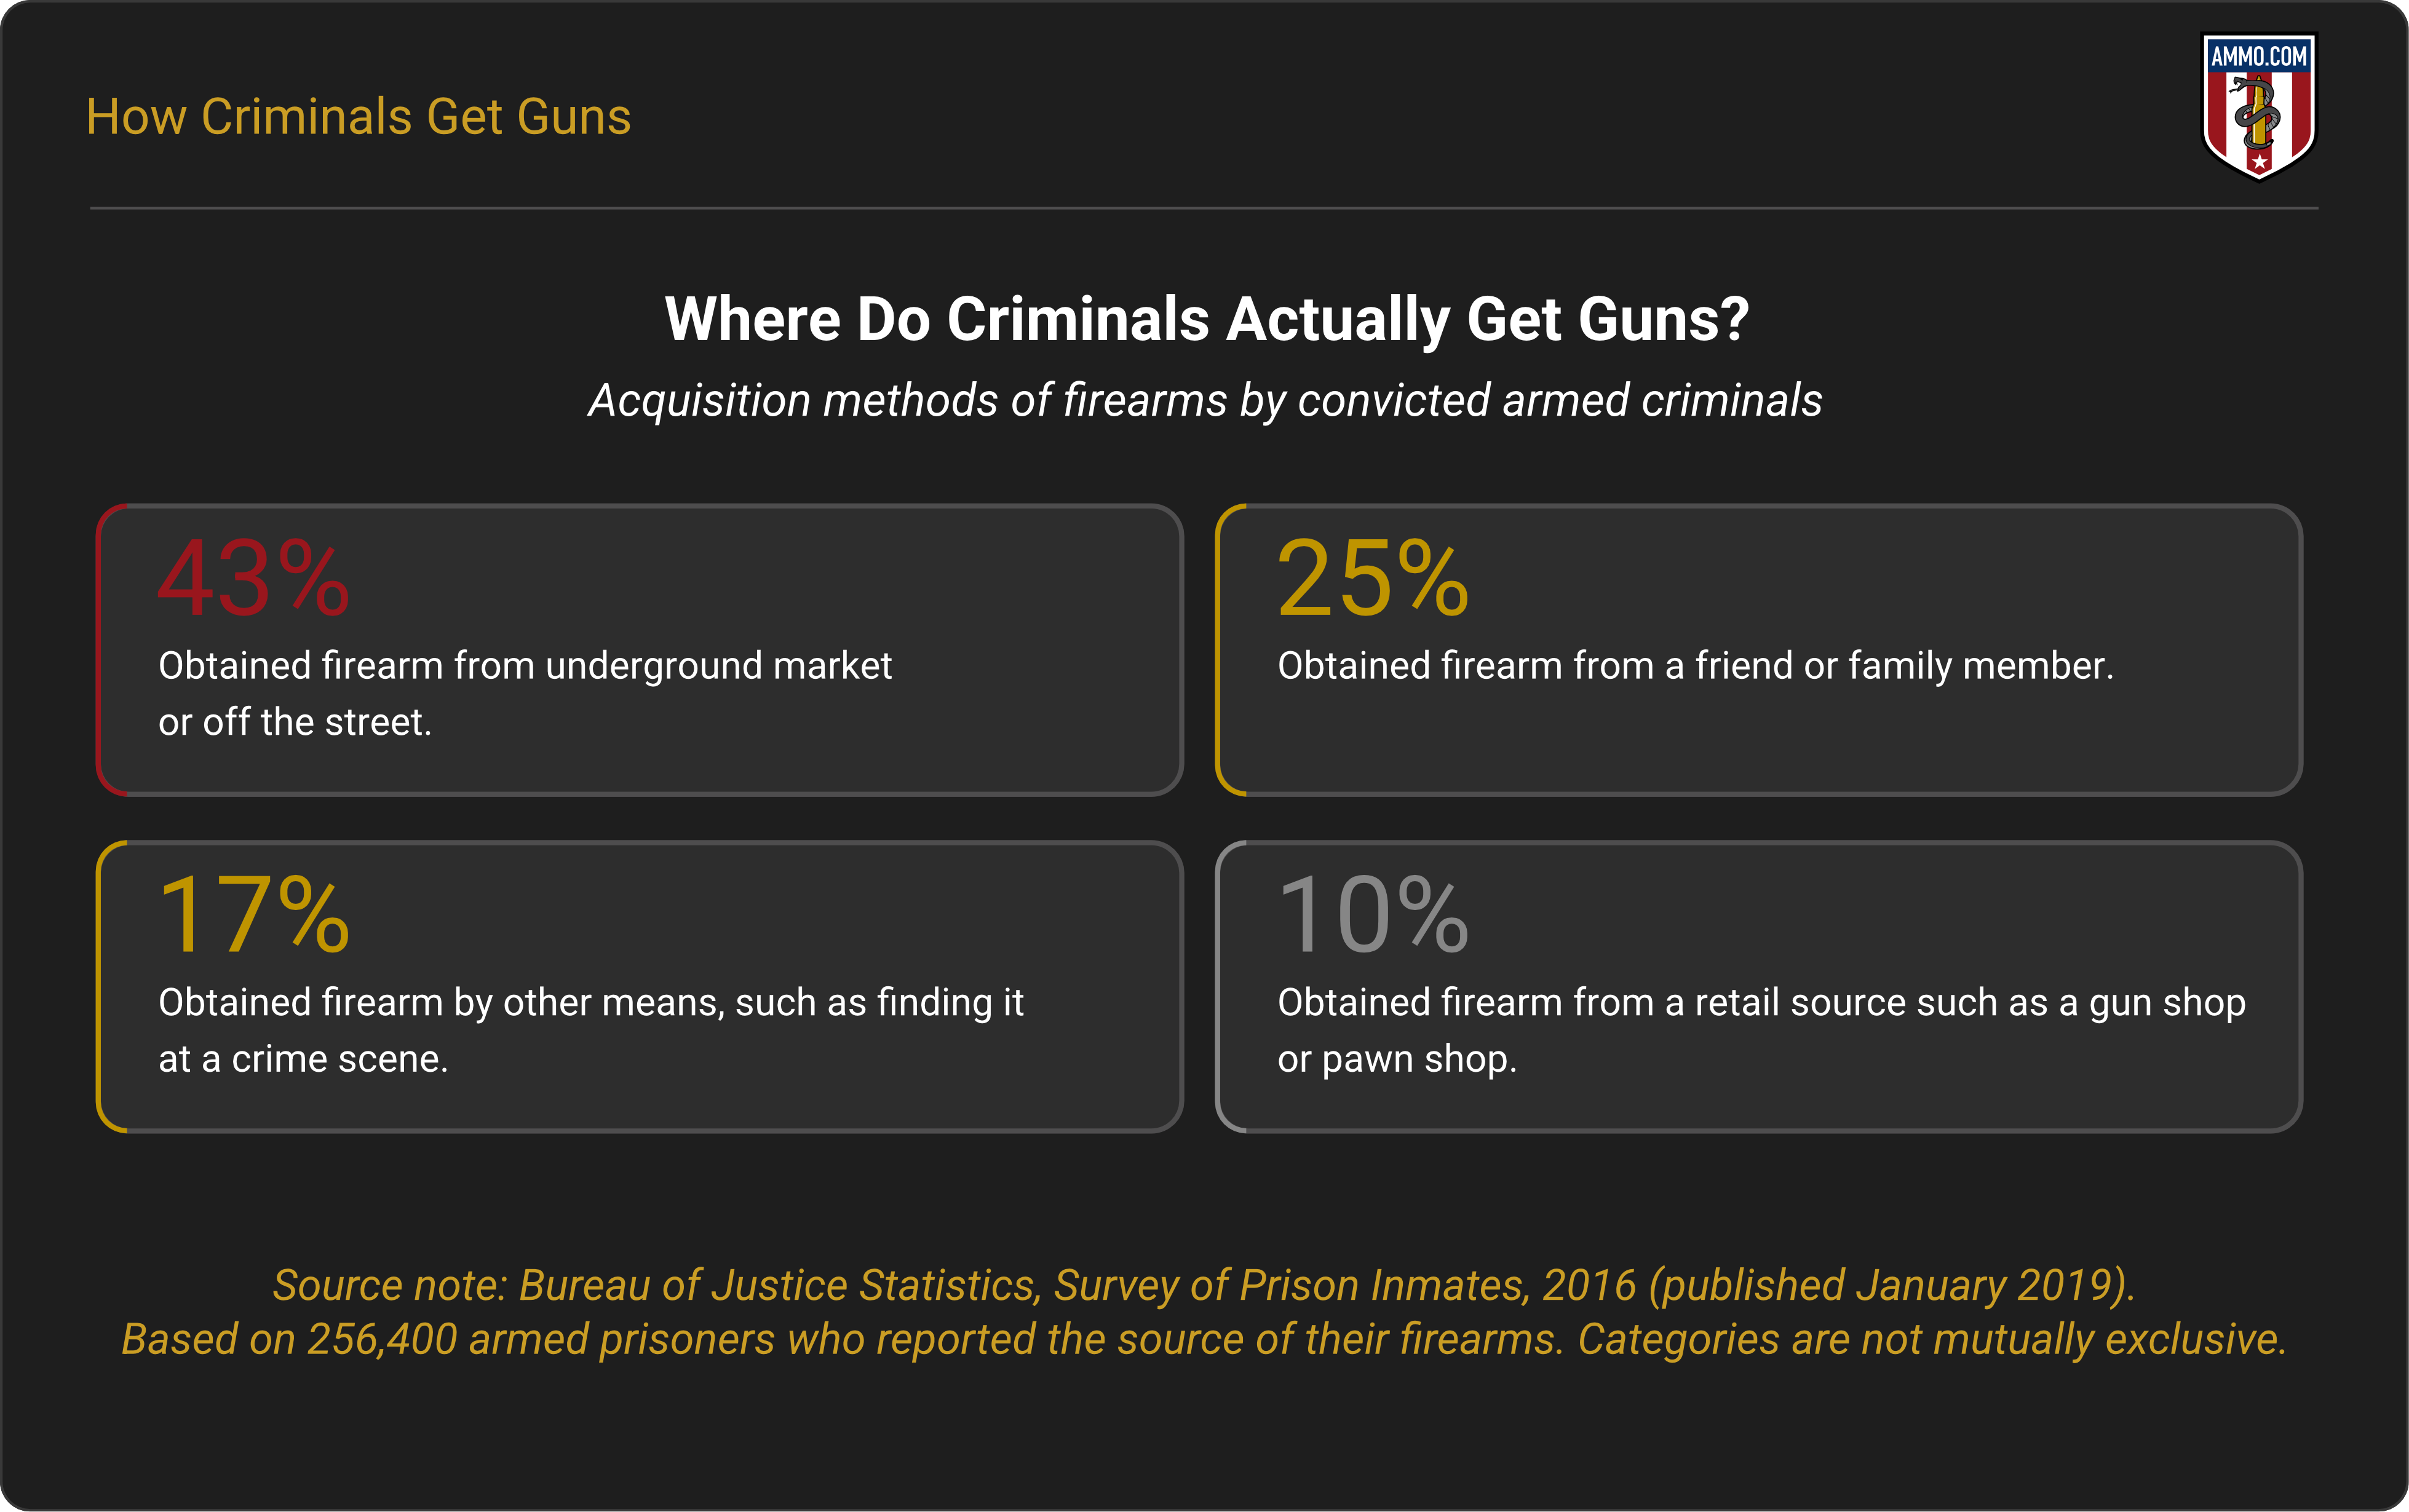
Of the estimated 256,400 armed prisoners who reported the source of their firearms in 2016, most obtained their firearms through an underground market or theft (43.2%). Some obtained firearms from an individual (25.3%). Others obtained them by other means (17.4%), such as finding the firearm at a crime scene, or having it purchased by someone else (likely a straw purchase) from a retail source (10.1%) or multiple sources (2.5%).2
The Black Market
According to a comprehensive BJS survey published in 2019, 43% of armed prisoners obtained their firearms off the street or from an underground source (implying a black market).2
The survey shows that nearly half of all convicted prisoners at state and federal levels who possessed a firearm during the commission of their crimes acquired the gun(s) from an individual who sold the firearm illegally (stolen guns, criminal enterprises, etc.).
Theft
According to the ATF, 1.1 million guns were reported stolen in the U.S. between 2019 and 2023. Of those, 95% were stolen from private citizens. For reference, we estimate that 500 million firearms are in civilians’ possession in the U.S. as of 2026. Adjusting for unreported firearm thefts, the ATF estimates that 220,000 firearms are stolen annually.4 A separate ATF report covering 2017 to 2021 estimated approximately 266,000 stolen firearms annually when adjusting for unreported thefts.10
Although hundreds of thousands of guns are stolen annually, the BJS report suggests that stolen guns are rarely unlawfully used by the person who committed the initial theft. In fact, only 6% of prisoners surveyed stole the firearms they possessed during the commission of their crimes.2
Friends and Family Members
According to the BJS, 25% of armed prisoners obtained the firearm they possessed during their crimes from a friend or family member. The majority (10.8%) of these inmates were gifted a gun or had a gun purchased for them (likely a straw purchase). Some convicts reportedly purchased or traded the firearm (8%). Others rented or borrowed the gun from its source (6.5%).2
Although the source of firearms is not measured in the report, a 2023 publication covering 103 participants by the Center for Justice Innovation suggested that family members gave Crown Heights, Brooklyn youths involved in gang and crime culture firearms for their protection.5
Purchased/Traded at Retail Source
According to the BJS, only one in ten armed prisoners obtained the firearms that they possessed during their crime from a retail source. Most retail-source purchasers (8.2%) of all armed prisoners obtained their firearms from a licensed firearm dealer.
Among armed prisoners, 10.1% bought or traded a firearm at a retail source; 7.5% obtained their firearms at a gun shop or store; 1.6% obtained theirs at a pawn shop; 0.8% obtained theirs at a gun show; and 0.4% at a flea market.2 Categories may overlap if the armed prisoners obtained firearms from additional sources.
Ninety percent of armed prisoners in this report obtained their firearms through means other than a retail source. Of the armed prisoners who purchased their firearms from licensed firearms dealers, 6.7% reported undergoing a background check.
For how that screening works at the counter, read our guide to firearm background checks and the NICS system.
What Share of Legally Purchased Guns Are Ever Used in a Crime?
Data on the share of legally purchased guns used in crimes are limited. A 2024 study examined firearms in California. The study's findings, although not nationally representative, found that less than 0.80% of legally purchased handguns and 0.24% of legally purchased long guns were used in a crime.6
On a broader scale, the ATF tracks a firearm’s time-to-crime (i.e. the time from purchase to trace during a criminal investigation). Between 2017 and 2023, the time-to-crime for a firearm from purchase to trace declined from 4.2 years in 2017 to 2.9 years in 2023 (31%). This suggests that despite criminals using guns in a shorter time from purchase, legally purchased firearms are not immediately being used or investigated in crimes.4
For a closer look at how lawful ownership tracks against crime at the city level, see our report on urban violent crime and legal gun ownership.
What Caliber Shows Up Most in Gun Crimes?
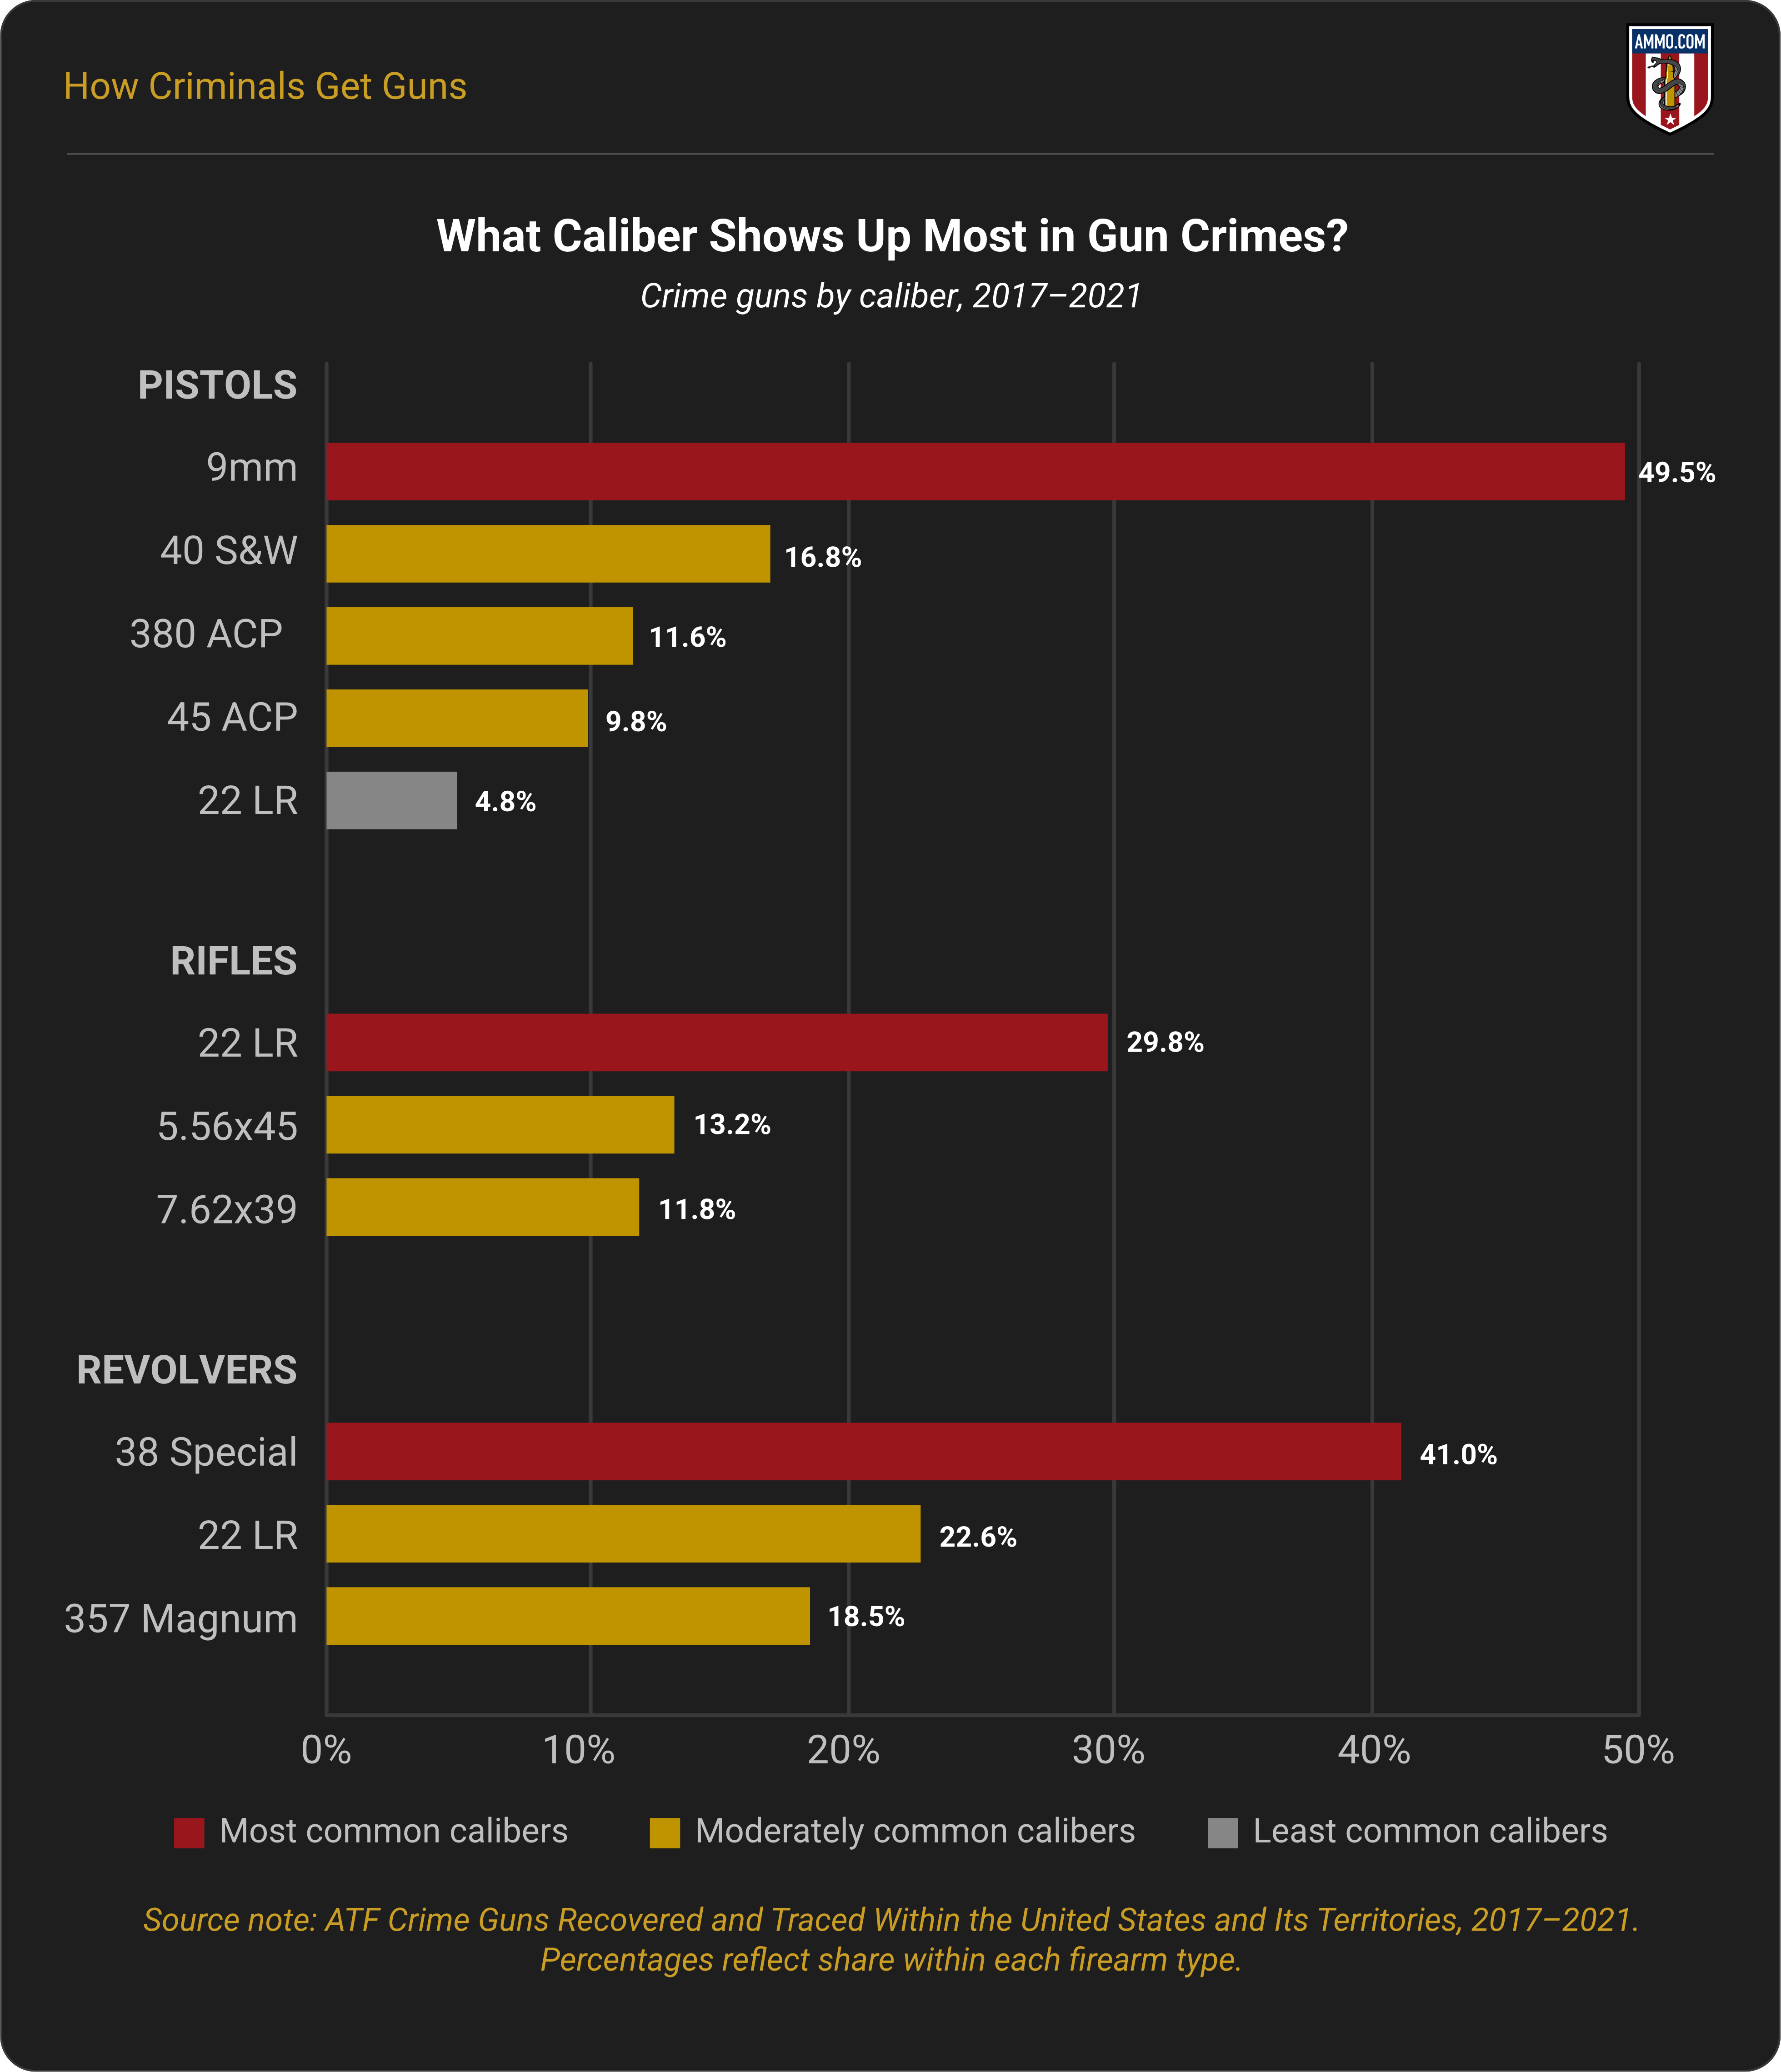
Law enforcement agencies across the U.S. submitted 1,922,577 trace requests (including successful and unsuccessful requests) to the ATF between 2017 and 2021. Of those, pistol calibers showed up most in the crime gun category. 9mm showed up most often in the pistol category (49.5%), followed by .40 S&W (16.8%), .380 ACP (11.6%), .45 ACP (9.8%), and .22 LR (4.8%).
The top rifle calibers traced during criminal investigations were .22 LR (29.8%), 5.56x45 (13.2%), and 7.62x39 (11.8%). Revolver calibers were assessed separately. .38 Special accounted for 41% of all revolvers traced, followed by .22 LR (22.6%) and .357 Magnum (18.5%).7
How Often Do Violent Criminals Use Guns?
The BJS reported 6.4 million violent crime victimizations in the U.S. in 2023. About 9% of those involved a firearm. These instances included a violent victimization where the offender possessed, showed, or used a firearm during the commission of their crime.8
According to the BJS, the annual average percentage of nonfatal violence between 2018 and 2022 involving an offender possessing a firearm was 8%. During this time, 64% of nonfatal violent victimizations were reported to police, compared to 45% of nonfirearm violence. Between 2018 and 2022, 80% of homicides were committed with a firearm. However, there was a 72% decline in nonfatal firearm violence from 1993 to 2023, from 7.3 victimizations per 1,000 people to 2.0.9
Homicide totals vary widely across the country, which our breakdown of the murder rate by state maps out.
Do Criminals Buy Guns at Gun Shows?
Guns used in crimes were rarely purchased at gun shows. According to the BJS, 0.8% of convicted inmates possessed a firearm purchased at a gun show during their crime.2 Between 2017 and 2021, 3% (41,810) of the 1,482,861 firearms successfully traced during an investigation were purchased from an FFL dealer at a gun show.7
While these data on licensed dealers at gun shows are clear, private sales are not widely tracked. The “gun show loophole” is not so much a legal loophole as it is private sales performed by individuals. These types of sales are not unique to gun shows, and are difficult to quantify unless those involved in the transaction choose to report the sale.
How Many Guns Used in Crimes Are Stolen?
Stolen guns used in crimes are challenging to quantify due to reporting issues (it is estimated that one-quarter of private gun thefts go unreported, for example). Between 2017 and 2021, 1,074,022 firearms were reported stolen from FFLs, interstate shipments, and private citizens.10 Available data suggest these guns are more likely to feed underground markets than be used by the person who stole them.10
Although 6% of prison inmates reported stealing the firearm they possessed during their crime, this does not account for the stolen firearms traded and sold to the convicted.2 One study suggests that dealer-purchased guns, later reported stolen, were nearly nine times more likely to be used in crimes than dealer-purchased guns that were not reported stolen.6 Meanwhile, ATF and BJS data suggest that there are enough stolen guns to arm one out of every five violent offenders annually.
Wrap-Up
A small fraction of civilian-owned firearms in the U.S. are traced during criminal investigations. Criminals rarely obtain firearms through legal channels. The majority of crime guns are obtained through underground markets, personal networks, and straw purchases. Unfortunately, it is difficult to trace and quantify the source of crime guns.
Nonfatal violent crime victimizations where the offender possesses a firearm account for a small fraction of violent crimes. However, firearms are used in the majority of homicides.
For the wider picture on how often firearms turn up in American crime, see our overview of gun violence statistics.
Sources
-
ATF: National Tracing Centeratf.gov
-
“Two Battlefields”: Opps, Cops, and NYC Youth Gun Cultureinnovatingjustice.org
-
ATF Part V: Firearm Theftsatf.gov

Infographics
- Are Guns & Ammo The New Gold? Why More Americans Are Arming Themselves
- The Greatest Gun Salesman In America: President Barack Obama
- Shooting Straight: How Both Presidential Candidates Have Changed On Gun Control
- President Obama: (Still) The Greatest Gun Salesman in America
- An Inconvenient Truth: How The Obama Administration Became Earth's Largest Arms Dealer
- Armed Drones: President Obama's Weapon of Choice
- COVID-19 Data Study: Ammunition Sales Continue to Soar in Response to Coronavirus Panic
- Data Study: 18 Months of Ammo Sales during a Pandemic, Protests, and the Biden Presidency
- Data Study: U.S. Ammo Sales Surge Following Russian Invasion of Ukraine
- Most Gun-Friendly States
- Worst States to be a Gun Owner
- Children & Firearms: Definitions and Demographics Make All the Difference
- Urban Violent Crime & Legal Gun Ownership
- Gun-Free School Zone Laws & School Shootings
- Gun Control Laws and Enforcement Trends
- Gun Ownership by State
- How Many Gun Owners are in America?
- Concealed Carry Crime Stats
- Accidental Shooting Statistics: A Review of Unintentional Firearm Deaths
- America's Stolen Guns: A Silent Contributor to Gun Crimes in the U.S.
- Gun Violence Statistics: Comprehensive Look at the Data
- Gun Laws vs. Crime Rates: A Comprehensive Analysis
- Gun Death Statistics by Caliber: A Review of Calibers and Crime
- Anti-Gun Control Arguments: Facts Gun Control Lobby Suppress
- Guns in the Home Statistics: The Effects of Firearms in the Home
- Gun Deaths in the US: Analyzing At-Risk Demographics
- How Many Guns in the U.S.: All About America's Firearms
- Gun Facts in the U.S.: The Reality of Firearms in America
- Defensive Gun Use Statistics: America's Life-Saving Gun Incidents
- Correlation Between Mass Shootings and Prescription Drugs
- Gun Ownership by Gender: Closing the Gender Gap
- Murders by Weapon Type: Statistics
- Gun Violence Among Black Americans: Statistics
- The Ultimate Hunting Caliber Chart: Best Cartridge Per Species
- How Old Do You Have to be to Buy a Gun: A State Guide
- Most Popular Guns in the U.S.: The Must-Have Guns
- Stray Bullet Deaths: Accident and Injury Statistics
- Mass Shooters by Race: Demographics of Assailants
- Ammunition Limits By State: How Much Ammo Can You Buy?
- Why Do Americans Own Guns?
- How Many Americans Want Stricter Gun Laws?
- How Many Households in the U.S. Have a Gun?
- What Percentage of Gun Deaths are Suicides?
- Average Age of Mass Shooters in the U.S.
- Firearm Ownership in America by Year
- US Firearms Deaths Per Year: A Collective Report
- Percentage of Americans Owning Guns
- Texas Gun Ownership: Total Numbers, Trends, and Most Popular Guns
- Gun Ownership Statistics Colorado: Trends & Numbers
- Hunting Accident Statistics (Causes & Trends Per Year)
- Banned Guns & Ammo List: A Review by State
- 3D Printed Gun Laws By State
- How To Build a Home Shooting Range: The Ultimate Guide
- States With the Highest Murder Rates
- Best Self-Defense Weapons for Women
- Easiest States to Buy a Gun
- Cities with the Lowest Crime Rate
- Oregon Homicide Rates
- Chicago Homicide Rate
- How Much Does a Suppressor Reduce Noise
- Texas Homicides: Statistics and Trends
- California Homicides: Rates Per 100K
- Florida Murder Rate: Statistics and Trends
- Gun Ownership by Political Party
- Mass Shooters by Gender
- U.S. Hunting and Fishing Statistics
- Where Are Silencers Illegal? State Suppressor Laws
- How Loud is a Gunshot?
- What States Have the Strictest Gun Control?
- Causes of Mass Shootings in the U.S.
- Ammo Manufacturers List
- How Criminals Get Guns